10-K: Annual report [Section 13 and 15(d), not S-K Item 405]
Published on February 25, 2026
UNITED STATES
SECURITIES AND EXCHANGE COMMISSION
Washington, D.C. 20549
________________________________________________
FORM 10-K
| (Mark One) | |||||
| ANNUAL REPORT PURSUANT TO SECTION 13 OR 15(d) OF THE SECURITIES EXCHANGE ACT OF 1934 | |||||
For the fiscal year ended December 31 , 2025
| OR | |||||
| TRANSITION REPORT PURSUANT TO SECTION 13 OR 15(d) OF THE SECURITIES EXCHANGE ACT OF 1934 | |||||
| For the transition period from to | |||||
Commission File Number 1-37654
____________
(Exact name of registrant as specified in its charter)
| (State or other jurisdiction of incorporation or organization) | (I.R.S. employer identification number) | |||||||
| (Address of principal executive offices) | (Zip code) | ||||||||||
Registrant’s telephone number, including area code: (425 ) 446 - 5000
Securities Registered Pursuant to Section 12(b) of the Act:
| Title of each class | Trading symbols | Name of each exchange on which registered | ||||||
Securities registered pursuant to Section 12(g) of the Act:
NONE
(Title of Class)
Indicate by check mark if the registrant is a well-known seasoned issuer as defined in Rule 405 of the Securities Act.
Indicate by check mark if the registrant is not required to file reports pursuant to Section 13 or Section 15(d) of the Act. Yes o No x
Indicate by check mark whether the registrant (1) has filed all reports required to be filed by Section 13 or 15(d) of the Securities Exchange Act of 1934 during the preceding 12 months (or for such shorter period that the registrant was required to file such reports) and (2) has been subject to such filing requirements for the past 90 days. Yes x No o
Indicate by check mark whether the registrant has submitted electronically every Interactive Data File required to be submitted pursuant to Rule 405 of Regulation S-T during the preceding 12 months (or for such shorter period that the registrant was required to submit such files). Yes x No o
Indicate by check mark whether the registrant is a large accelerated filer, an accelerated filer, a non-accelerated filer, a smaller reporting company, or an emerging growth company. See the definitions of “large accelerated filer,” “accelerated filer,” “smaller reporting company” and “emerging growth company” in Rule 12b-2 of the Exchange Act.
| x | Accelerated filer | ¨ | ||||||||||||||||||
| Non-accelerated filer | ¨ | Smaller reporting company | ||||||||||||||||||
| Emerging growth company | ||||||||||||||||||||
If an emerging growth company, indicate by check mark if the registrant has elected not to use the extended transition period for complying with any new or revised financial accounting standards provided pursuant to Section 13(a) of the Exchange Act. o
Indicate by check mark whether the registrant has filed a report on and attestation to its management’s assessment of the effectiveness of its internal control over financial reporting under Section 404(b) of the Sarbanes-Oxley Act (15 U.S.C. 7262(b)) by the registered public accounting firm that prepared or issued its audit report. ý
If securities are registered pursuant to Section 12(b) of the Act, indicate by check mark whether the financial statements of the registrant included in the filing reflect the correction of an error to previously issued financial statements. ☐
Indicate by check mark whether any of those error corrections are restatements that required a recovery analysis of incentive-based compensation received by any of the registrant's executive officers during the relevant recovery period pursuant to § 240.10D-1(b). ☐
Indicate by check mark whether the registrant is a shell company (as defined in Rule 12b-2 of the Exchange Act). Yes ☐ No ý
As of February 20, 2026 there were 307,859,190 shares of Registrant’s common stock outstanding. The aggregate market value of common stock held by non-affiliates of the Registrant as of June 27, 2025 was $18.2 billion, based upon the closing price of the Registrant’s common stock on the New York Stock Exchange.
____________________________________
DOCUMENTS INCORPORATED BY REFERENCE
Part III incorporates certain information by reference from the Registrant’s proxy statement for its 2026 annual meeting of stockholders (the “2026 Proxy Statement”) to be filed pursuant to Regulation 14A within 120 days after Registrant’s fiscal year-end. With the exception of the sections of the 2026 Proxy Statement specifically incorporated herein by reference, the 2026 Proxy Statement is not deemed to be filed as part of this Form 10-K.
TABLE OF CONTENTS
| Page | |||||||||||
| Part I. | |||||||||||
| Item 1. | |||||||||||
| Item 1A. | |||||||||||
| Item 1B. | |||||||||||
Item 1C. | |||||||||||
| Item 2. | |||||||||||
| Item 3. | |||||||||||
| Item 4. | |||||||||||
| Part II. | |||||||||||
| Item 5. | |||||||||||
| Item 6. | |||||||||||
| Item 7. | |||||||||||
| Item 7A. | |||||||||||
| Item 8. | |||||||||||
| Item 9. | |||||||||||
| Item 9A. | |||||||||||
| Item 9B. | |||||||||||
| Item 9C. | |||||||||||
| Part III. | |||||||||||
| Item 10. | |||||||||||
| Item 11. | |||||||||||
| Item 12. | |||||||||||
| Item 13. | |||||||||||
| Item 14. | |||||||||||
| Part IV. | |||||||||||
| Item 15. | |||||||||||
| Item 16. | |||||||||||
1
INFORMATION RELATING TO FORWARD-LOOKING STATEMENTS AND RISK FACTOR SUMMARY
Certain statements included or incorporated by reference in this Annual Report on Form 10-K, in other documents we file with or furnish to the Securities and Exchange Commission (“SEC”), in our press releases, webcasts, conference calls, materials delivered to shareholders and other communications, are “forward-looking statements” within the meaning of the United States federal securities laws. All statements other than historical factual information are forward-looking statements, including without limitation statements regarding: projections of revenue, expenses, profit, profit margins, tax rates, tax provisions, cash flows, pension and benefit obligations and funding requirements, our liquidity position or other financial measures; impact of government actions, including tariffs, other trade policies, government spending and tax laws; management’s plans and strategies for future operations, including statements relating to anticipated operating performance, cost reductions, restructuring activities, new product and service developments, competitive strengths or market position, acquisitions, divestitures, strategic opportunities, securities offerings, stock repurchases, dividends and executive compensation; growth, declines and other trends in markets we sell into, including the expected impact of trade and tariff policies; the anticipated impacts and benefits of the completed separation of Ralliant Corporation (“Ralliant”); new or modified laws, regulations and accounting pronouncements; impact of climate-related events or transition activities; outstanding claims, legal proceedings, tax audits and assessments and other contingent liabilities; foreign currency exchange rates and fluctuations in those rates; impact of changes to tax laws; general economic and capital markets conditions, including expected impact of inflation or interest rate changes; impact of geopolitical events and other hostilities; the timing of any of the foregoing; assumptions underlying any of the foregoing; and any other statements that address events or developments that we intend or believe will or may occur in the future. Terminology, such as “believe,” “anticipate,” “should,” “could,” “intend,” “will,” “plan,” “expect,” “estimate,” “project,” “target,” “may,” “possible,” “potential,” “forecast” and “positioned” and similar references to future periods, are intended to identify forward-looking statements, although not all forward-looking statements are accompanied by such words. Forward-looking statements are based on assumptions and assessments made by our management in light of their experience and perceptions of historical trends, current conditions, expected future developments and other factors they believe to be appropriate. These forward-looking statements are subject to a number of risks and uncertainties, including but not limited to the risks and uncertainties set forth under “Item 1A. Risk Factors” in this Annual Report.
Forward-looking statements are not guarantees of future performance and actual results may differ materially from the results, developments, and business decisions contemplated by our forward-looking statements. Accordingly, you should not place undue reliance on any such forward-looking statements. Forward-looking statements speak only as of the date of the report, document, press release, webcast, call, materials or other communication in which they are made (or such earlier date as may be specified in such statement). We do not assume any obligation to update or revise any forward-looking statement, whether as a result of new information, future events and developments or otherwise.
The following is a summary of the material risks and uncertainties we face, which are discussed more fully in “Item 1A. Risk Factors” in this Annual Report:
Risk Related to Our Business Operations
•Conditions in the global economy, the markets we serve, and the financial markets may adversely affect our business and financial results.
•If we cannot adjust our manufacturing capacity, supply chain management or the purchases required for our manufacturing activities to reflect changes in market conditions, international trade policies, customer demand and supply chain disruptions, our profitability may suffer. In addition, our reliance upon sole or limited sources of supply for certain materials, components, and services could cause production interruptions, delays and inefficiencies.
•Our financial results are subject to fluctuations in the cost and availability of commodities or components that we use in our operations.
•Our growth could suffer if the markets into which we sell our products and services decline, do not grow as anticipated, or experience cyclicality.
•We face intense competition and if we are unable to compete effectively, we may experience decreased demand and decreased market share. Even if we compete effectively, we may be required to reduce prices for our products and services.
•Our growth depends in part on the timely development, commercialization and customer acceptance of new and enhanced products and services based on technological innovation.
2
•Our ability to successfully manage our leadership transition in connection with the completed Separation and attract, develop, and retain senior leaders and other key employees is critical to our success.
•Disruptions in, or breaches in security of, our information technology systems, exfiltration of confidential or sensitive data, and other cyberattacks have adversely affected, and in the future could adversely affect, our business.
•Defects and unanticipated use or inadequate disclosure with respect to our products (including software) or services could adversely affect our business, reputation, and financial results.
•Adverse changes in our relationships with, or the financial condition, performance, purchasing patterns, or inventory levels of, key distributors and other channel partners could adversely affect our financial results.
•Work stoppages, works council campaigns, and other labor disputes could adversely impact our productivity and results of operations.
•If we suffer loss to our facilities, supply chains, distribution systems, or information technology systems due to catastrophe or other events, our operations could be seriously harmed.
•If we do not or cannot adequately protect our intellectual property, or if third parties infringe our intellectual property rights, we may suffer competitive injury or expend significant resources enforcing our rights.
•Third parties may claim that we are infringing or misappropriating their intellectual property rights and we could suffer significant litigation expenses, losses, or licensing expenses or be prevented from selling products or services.
•Our restructuring activities could have long-term adverse effects on our business.
•We are subject to a variety of litigation and other legal and regulatory proceedings in the course of our business that could adversely affect our financial results.
•Climate change, or legal or regulatory measures to address climate change, may negatively affect us.
•We use artificial intelligence in our business and in certain of our products, and challenges with properly managing its use could result in reputational harm, competitive harm, and legal liability, and adversely affect our results of operations.
Risk Related to our International Operations
•International economic, political, legal, compliance, and business factors could negatively affect our financial results.
•Trade relations between the United States and other countries have been volatile and could have a material adverse effect on our business and financial results.
•Foreign currency exchange rates, including the volatility thereof, may adversely affect our financial results.
Risk Related to Our Investments and Dispositions
•Our strategy requires us to execute and deliver disciplined capital allocation.
•Our acquisition of businesses, investments, joint ventures, and other strategic relationships could negatively impact our financial results.
•The indemnification provisions of acquisition agreements by which we have acquired companies may not fully protect us and as a result we may face unexpected liabilities.
•Divestitures or other dispositions could negatively impact our business, and contingent liabilities from businesses that we have sold could adversely affect our financial results.
•Potential indemnification liabilities to Ralliant and Vontier Corporation (“Vontier”) pursuant to the respective separation agreements could materially and adversely affect our businesses, financial condition, results of operations, and cash flows.
3
Risk Related to Regulatory and Compliance Matters
•Changes in industry standards and governmental regulations may reduce demand for our products or services or increase our expenses.
•Our reputation, ability to do business, and financial results may be impaired by improper conduct by any of our employees, agents, or business partners.
•Our operations, products, and services expose us to the risk of environmental, health, and safety liabilities, costs, and violations that could adversely affect our reputation and financial results.
•Our businesses are subject to extensive regulation, including healthcare regulations; failure to comply with those regulations could adversely affect our financial results and our business, including our reputation.
Risk Related to Our Tax and Accounting Matters
•Changes in our effective tax rates or exposure to additional tax liabilities or assessments could affect our profitability. In addition, audits by tax authorities could result in additional tax payments for prior periods.
•We could incur significant liability if our separation from Danaher, our separation of Vontier or our separation of Ralliant (together, the “Separation Transactions”) are determined to be a taxable transaction.
•Changes in U.S. GAAP could adversely affect our reported financial results and may require significant changes to our internal accounting systems and processes.
•We may be required to recognize impairment charges for our goodwill and other intangible assets.
Risk Related to Our Financing Activities
•We have incurred a significant amount of debt, and our debt obligations, including the cost of such debt, will increase further if we incur additional debt and do not retire existing debt, our credit rating declines, or if the applicable interest rates rise.
PART I
ITEM 1. BUSINESS
General
Fortive Corporation innovates essential technologies to keep our world safe and productive. Our strategic segments - Intelligent Operating Solutions and Advanced Healthcare Solutions - include iconic inventor brands with leading positions in their markets. Our businesses design, develop, manufacture, and market products, software, and services, building upon leading brand names, innovative technologies, and strong market positions. We are headquartered in Everett, Washington and have a workforce of more than 10,000 research and development, manufacturing, sales, distribution, service, and administrative professionals in approximately 50 countries around the world.
On June 28, 2025, we separated our Precision Technologies segment business into an independent publicly-traded company (the “Separation”) named Ralliant Corporation (“Ralliant”). The Separation was effected to qualify as a tax-free spin-off for Fortive shareholders for U.S. federal income tax purposes.
Fortive Corporation is a Delaware corporation and was incorporated in 2015 in connection with the separation of Fortive from Danaher Corporation (“Danaher” or “Former Parent”) on July 2, 2016 as an independent, publicly-traded company, listed on the New York Stock Exchange.
In this Annual Report, the terms “Fortive” or the “Company” refer to either Fortive Corporation or to Fortive Corporation and its consolidated subsidiaries, as the context requires. Unless otherwise indicated, all amounts in this Annual Report refer to continuing operations.
4
Fortive Business System
Our teams across our operating companies are united by our culture of continuous improvement – characterized by the high expectations, inclusion, humility, and transparency embodied in the Fortive Business System (“FBS”). This cultural foundation is reinforced by the rigor of our disciplined operating cadence. FBS enables us to operate our businesses with a focus on relentless execution, powered by our mindset and a set of tools and best practices consistently applied across our portfolio. We are continually evolving FBS to accelerate and sustain progress in every aspect of our business and deliver on our “Fortive Accelerated” strategy of faster profitable growth, disciplined capital allocation and building and maintaining investor trust. In doing so, we have incorporated new technology enablers, like artificial intelligence and machine learning and are building new capabilities to drive accelerated innovation, greater commercial success and more recurring customer value. FBS is a critical component of how we achieve sustained success over time.
Purpose and Values
We are guided by our shared purpose, innovating essential technologies to keep our world safe and productive. We strive to accelerate transformation in high-impact fields, such as workplace and industrial safety, and healthcare, delivering advanced technology solutions with high impact for frontline workers, healthcare professionals, patients, and more, worldwide.
Our values guide how we deliver every day for our stakeholders:
We build extraordinary teams for extraordinary results.
We believe we are more together, and we all have something unique to offer as we come together to solve problems no one could solve alone, committed to a strong and inclusive culture.
Customer success inspires our innovation.
We believe our most important breakthroughs are the ones that help our customers succeed, and we strive to break down barriers and forge new paths to world-changing innovations to move our customers forward.
Kaizen is our way of life.
We know we can always do and be better. Our commitment to continuous improvement, grounded in our FBS inspires us to approach our work with curiosity. We are always growing and learning.
We compete for our shareholders.
We believe in prioritizing trust, sustainability, and positive impact to create long-term value for all of our stakeholders, including our shareholders, our employees, our customers and our communities.
Reportable Segments
We operate and report our results in two segments, Intelligent Operating Solutions and Advanced Healthcare Solutions, both of which are further described below.
Intelligent Operating Solutions
Our Intelligent Operating Solutions segment provides advanced instrumentation, software and services to tens of thousands of customers enabling their mission-critical workflows. These offerings include professional instruments used in applications including maintenance, repair, measurement and condition monitoring, facility and asset lifecycle software applications, connected worker safety and compliance solutions across a range of vertical end markets, including manufacturing, process industries, healthcare, utilities and power, communications and electronics, among others. Typical users of these safety, productivity and sustainability solutions include electrical engineers, electricians, electronic technicians, EHS professionals, network technicians, facility managers, first-responders, and maintenance professionals.
Products and services within our Intelligent Operating Solutions segment are marketed under a variety of leading brands, including FLUKE, SERVICECHANNEL, GORDIAN, ACCRUENT, INDUSTRIAL SCIENTIFIC, and INTELEX.
Advanced Healthcare Solutions
Our Advanced Healthcare Solutions segment supplies critical workflow solutions enabling healthcare providers to deliver exceptional patient care more efficiently. Our offerings include instrument sterilization solutions, instrument tracking, biomedical test tools, radiation detection and safety monitoring, and end-to-end clinical productivity software and solutions.
5
Our healthcare offerings help ensure critical safety standards are met, instruments and operating rooms are working at peak performance, and complex procedures are followed accurately in these mission-critical healthcare environments.
Products and services in our Advanced Healthcare Solutions segment are marketed under a variety of brands, including ADVANCED STERILIZATION PRODUCTS “ASP”, CENSIS, FLUKE BIOMEDICAL, LANDAUER, and PROVATION.
************************************
The following discussion includes information common to all of our segments.
Materials
Our manufacturing operations employ a wide variety of raw materials, including electronic components, steel, plastics and other petroleum-based products, aluminum, and copper. Prices of oil and gas affect our costs for freight and utilities. We purchase raw materials from a large number of independent sources around the world. Tariffs affect our costs for impacted materials or components we import into the United States. Based on allocation of annual spend among our various suppliers, no single supplier is material. However, some components that require particular specifications or qualifications are dependent on a single supplier or a limited number of suppliers that can readily provide such components. We utilize a number of techniques to address potential disruption in and other risks relating to our supply chain, including in certain cases the use of safety stock, alternative materials that meet the quality and regulatory requirements, and qualification of multiple supply sources. While recent volatility in global trade policy and the remediation efforts taken by certain jurisdictions in response to events, and the disruptions from the Ukraine/Russia conflict and other geopolitical tensions and conflicts, have raised material and shipping costs, our supply chain was responsive to these dynamics, and we implemented solutions, including through FBS and working collaboratively with our suppliers, to effectively support our operations, and help countermeasure production material shortages and distribution limitations. For a further discussion of risks related to the materials and components required for our operations, please refer to “Item 1A. Risk Factors.”
Intellectual Property
We own numerous patents, trademarks, copyrights, and trade secrets and hold licenses to use intellectual property owned by others. Although in aggregate our intellectual property is important to our operations, we do not consider any single patent, trademark, copyright, trade secret, or license to be of material importance to any segment or to the business as a whole. From time to time, we engage in litigation to protect our intellectual property rights. For a discussion of risks related to our intellectual property, please refer to “Item 1A. Risk Factors.” All capitalized brands and product names throughout this document are trademarks owned by, or licensed to, Fortive.
Competition
We believe that we are a leader in many of our served markets. Although our businesses generally operate in highly competitive markets, our competitive position cannot be determined accurately in the aggregate or by segment, since none of our competitors offer all of the same product and service lines or serve all of the same markets as we do. Because of the range of the products and services we sell and the variety of markets we serve, we encounter a wide variety of competitors, including larger companies or divisions of larger companies with substantial sales, marketing, research, and financial capabilities, as well as well-established regional competitors who are more specialized than we are in particular markets. We face increased competition in a number of our served markets as a result of the entry of competitors based in low-cost manufacturing locations, and increasing consolidation in particular markets. The number of competitors varies by product and service line. Our management believes that we have a market leadership position in most of the markets we serve. Key competitive factors vary among our businesses and product and service lines, but include the specific factors noted above with respect to each particular business and typically also include price, quality, performance, delivery speed, applications expertise, distribution channel access, service and support, technology and innovation, breadth of product, service and software offerings, and brand name recognition. For a discussion of risks related to competition, please refer to “Item 1A. Risk Factors.”
Seasonal Nature of Business
General economic conditions impact our business and financial results, and certain of our businesses experience seasonal and other trends related to the industries and end markets that they serve. For example, sales of capital equipment and sterilization consumables are often stronger in the fourth calendar quarter and sales to OEMs are often stronger immediately preceding and following the launch of new products. However, as a whole, we are not subject to material seasonality.
6
People Strategy
Our Fortive team of over 10,000 people around the world are united by a powerful purpose: innovating essential technologies to keep our world safe and productive.
Our Fortive Accelerated growth strategy is the engine that drives that purpose forward, increasing our positive impact. The Fortive Accelerated strategy is built on three pillars: profitable organic growth acceleration powered by the amplified Fortive Business System (FBS), disciplined capital allocation, and a commitment to building investor trust.
Our people are the foundation of this Fortive Accelerated growth strategy. Creating an outstanding employee experience, where each team member feels empowered, supported, and proud is a critical driver of our sustainable success.
We advance our people strategy through thoughtful employee experience management – using deep understanding of our people, continuous feedback mechanisms, and a clear cultural compass to guide how we design and deliver our people practices, with a particular focus on our career development and rewards systems. We are committed to nurturing and continuously improving Fortive as an amazing place to work – so we can achieve more for our customers, our teams, and the world.
Our Board of Directors, along with the Compensation Committee, oversee our people strategy, culture, and rewards systems.
Culture
Our inclusive growth culture underpins Fortive’s people strategy to deliver on our employee experience promise: For you. For us. For growth.
We foster an inclusive environment supercharged by continuous improvement, innovation, and growth mindsets to enable team members to meaningfully grow their careers, make an impact, and feel true ownership in our shared success.
Career Development and Reward Systems
Our career development systems advance our people strategy by attracting, developing, and retaining the exceptional people we need now and in the future. Specifically, our performance and development processes drive outcomes and career growth for our global teams. Performance for Growth deploys our strategies into clear goals throughout the organization, while Development for Growth ensures excellence in how those results were achieved. This translates the behaviors that underpin our desired leader competencies, at all levels of the organization. Together, these systems provide a roadmap for the way we work, deliver results, and build amazing day-to-day experiences in the workplace.
We also invest in our people at every level through our development experiences. These experiences range from leadership learning to curated skills-based learning pathways, to hands-on skill building in each of our three FBS pillars: growth, lean, and leadership.
FBS has been infused with AI capabilities, streamlining and reinforcing our growth-oriented tools and training for team members. Collectively, these tools and experiences enhance development, strengthen performance, and prepare our team members for challenging opportunities and outsized impact.
With our market-leading portfolio and performance and development approach, our people have the opportunity to accelerate their career across multiple industries, contribute to customer success, and make a meaningful impact in the world.
Our Total Rewards programs are designed to attract and retain talented, curious people with a growth mindset and a passion for innovation, collaboration, and continuous improvement. We offer leading programs that inspire and reward superior performance, paired with comprehensive benefits that enhance holistic well-being for every employee and their families.
Fortive is committed to adhering to Equal Employment Opportunity (EEO) principles. All people are evaluated through a neutral merit-based process. We do not consider race, ethnicity, gender, or any other protected trait in our hiring, promotional, or other processes.
Government Contracts
Although the majority of our revenue in 2025 was from customers other than governmental entities, each of our segments has agreements relating to the sale of products and services to government entities. As a result, we are subject to various statutes
7
and regulations that apply to companies doing business with governments and government-owned entities. For a discussion of risks related to government contracting requirements, please refer to “Item 1A. Risk Factors.”
Regulatory Matters
We face extensive government regulation both within and outside the United States relating to the development, manufacture, marketing, sale, and distribution of our products, software, and services. The following sections describe certain significant regulations that we are subject to. These are not the only regulations that our businesses must comply with. For a description of the risks related to the regulations that our businesses are subject to, please refer to “Item 1A. Risk Factors.”
Medical Device Regulations
Many of our products in the Advanced Healthcare Solutions segment are classified as medical devices and are subject to restrictions under domestic and foreign laws, rules, regulations, self-regulatory codes, circulars, and orders, including, but not limited to, the U.S. Food, Drug, and Cosmetic Act (the “FDCA”). The FDCA requires these products, when sold in the United States, to be safe and effective for their intended uses and to comply with the regulations administered by the U.S. Food and Drug Administration (“FDA”). The FDA regulates the design, development, research, preclinical and clinical testing, introduction, manufacture, advertising, labeling, packaging, marketing, distribution, import and export, and record keeping for such products.
Medical devices can be marketed only for the indications for which they are cleared or approved. After a device has received 510(k) clearance for a specific intended use, any change or modification that significantly affects its safety or effectiveness, such as a significant change in the design, materials, method of manufacture, or intended use, may require a new 510(k) clearance and payment of an FDA user fee.
Market access, sales, and marketing of medical devices in non-U.S. countries are subject to foreign regulatory requirements that vary widely from country to country. For example in the European Economic Area (“EEA”), a medical device must meet the Medical Devices Directive’s (“MDD”) Essential Requirements or, for new devices placed on the market after May 26, 2021, the Medical Devices Regulation’s (“MDR”) General Safety and Performance Requirements as well as other requirements set out in the MDD/MDR, depending on the device’s risk class. Before placing a medical device on the EEA market, the manufacturer must prepare a declaration of conformity, certifying that the device complies with the MDD/MDR, and must then affix the CE mark. The notified body typically audits and examines the device’s technical documentation, and the quality system for the manufacture, design, and final inspection of the relevant device before issuing a CE certificate. Following the issuance of this CE certificate, manufacturers may prepare the declaration of conformity and affix the CE mark to the devices covered by this CE certificate. Similar requirements apply in the UK. For access to the UK market, manufacturers must obtain a UKCA Certificate and affix a UKCA mark to their medical devices.
Any medical devices we manufacture and distribute are subject to pervasive and continuing regulation by the FDA and certain state and certain other comparable foreign authorities. As a medical device manufacturer, our manufacturing facilities are subject to inspection on a routine basis by the FDA and other comparable foreign authorities as well as audits by our notified body. We are required to adhere to the Current Good Manufacturing Practices requirements, as set forth in the Quality Systems Regulation, as well as other applicable standards which require manufacturers, including third-party manufacturers, to follow stringent design, testing, control, documentation, and other quality assurance procedures during all phases of the design and manufacturing process.
We must also comply with global post-market surveillance regulations, including adverse event reporting requirements, which require that we review and report to the FDA and other comparable foreign authorities any incident in which our products may have caused or contributed to a death or serious injury. We must also report any incident in which our product has malfunctioned if that malfunction would likely cause or contribute to a death or serious injury if it were to recur.
Labeling and promotional activities are subject to scrutiny by the FDA and other comparable foreign authorities and, in certain circumstances, by the Federal Trade Commission and other comparable foreign regulators. Medical devices approved or cleared by the FDA, foreign regulators, or our notified body may not be promoted for undocumented, unapproved, or uncleared uses, otherwise known as “off-label” promotion. The FDA, other U.S. agencies, and other comparable foreign authorities actively enforce the laws and regulations prohibiting the promotion of off-label uses.
Other Healthcare Laws
We are subject to various healthcare related laws regulating fraud and abuse, research and development, pricing and sales and marketing practices, and the privacy and security of health information. In particular, the U.S. Federal Anti-Kickback Statute prohibits persons from knowingly and willfully soliciting, offering, receiving, or providing remuneration (including any
8
kickback or bribe), directly or indirectly, in exchange for or to induce either the referral of an individual, or the furnishing or arranging for a good or service, for which payment may be made in whole or in part under a federal healthcare program, such as Medicare or Medicaid. A person or entity does not need to have actual knowledge of the statute or specific intent to violate it in order to have committed a violation. Similar laws and regulations apply in many foreign countries.
The Health Insurance Portability and Accountability Act of 1996 (“HIPAA”) prohibits knowingly and willfully (1) executing, or attempting to execute, a scheme to defraud any healthcare benefit program, including private payors, or (2) falsifying, concealing, or covering up a material fact or making any materially false, fictitious, or fraudulent statement in connection with the delivery of or payment for healthcare benefits, items, or services. In addition, HIPAA, as amended by the Health Information Technology for Economic and Clinical Health Act of 2009, also restricts the use and disclosure of patient identifiable health information, mandates the adoption of standards relating to the privacy and security of patient identifiable health information, and requires the reporting of certain security breaches with respect to such information. Similar to the U.S. Federal Anti-Kickback Statute, a person or entity does not need to have actual knowledge of the healthcare fraud statute implemented under HIPAA or specific intent to violate it in order to have committed a violation. Similar laws and regulations apply in many foreign countries.
The False Claims Act imposes liability on any person or entity that, among other things, knowingly presents, or causes to be presented, a false or fraudulent claim for payment by a federal healthcare program, knowingly makes, uses, or causes to be made or used, a false record or statement material to a false or fraudulent claim, or knowingly makes a false statement to avoid, decrease, or conceal an obligation to pay money to the U.S. federal government. The qui tam provisions of the False Claims Act allow a private individual to bring actions on behalf of the federal government alleging that the defendant has submitted a false claim to the federal government, and to share in any monetary recovery. In addition, the government may assert that a claim including items and services resulting from a violation of the U.S. Federal Anti-Kickback Statute constitutes a false or fraudulent claim for purposes of the civil False Claims Act. Similar laws and regulations apply in many foreign countries.
Federal consumer protection and unfair competition laws broadly regulate marketplace activities and activities that potentially harm consumers. Analogous U.S. state laws and regulations, such as state anti-kickback and false claims laws, also may apply to our business practices, including but not limited to, research, distribution, sales and marketing arrangements, and claims involving healthcare items or services reimbursed by any third-party payor, including private insurers. Further, there are state laws that require medical device manufacturers to comply with the voluntary compliance guidelines and the relevant compliance guidance promulgated by the U.S. federal government, or otherwise restrict payments that may be made to healthcare providers and other potential referral sources; state laws and regulations that require manufacturers to file reports relating to pricing and marketing information, which requires tracking gifts and other remuneration and items of value provided to healthcare professionals and entities; state and local laws requiring the registration of sales representatives; and state laws governing the privacy and security of health information in certain circumstances, many of which differ from each other in significant ways and often are not preempted by HIPAA. Similar laws and regulations apply in many non-U.S. countries.
Anti-Bribery and Anti-Corruption Laws
Given the international scope of our operations, we are subject to various U.S. and non-U.S. laws outlawing bribes, kickbacks, payoffs, and other improper payments. In particular, the U.S. Foreign Corrupt Practices Act (“FCPA”), the UK Bribery Act, and other similar laws in other jurisdictions prohibit companies, their officers and employees, and their intermediaries from making improper payments to public officials to influence those officials or secure an improper advantage in order to obtain or retain business. In the past several years, there has been a substantial increase in the enforcement of these global anti-bribery and anti-corruption laws. Our operations throughout the world, including in developing countries with heightened risks of corruption, and interactions with individuals who are considered public officials under these laws, such as healthcare professionals in countries with state-run healthcare systems, expose us to the risk of violating these laws. Violations of these laws or even allegations of violations of these laws could pose reputational risks, subject us to investigations and related litigation, cause disruptions to our business, and result in monetary fines and damages and other sanctions.
Data Privacy and Security Laws
As a global organization, we are subject to data privacy and security laws, regulations, and customer-imposed controls in numerous jurisdictions as a result of having access to and processing confidential, personal, and/or sensitive data in the course of our business.
Data privacy and security laws are rapidly evolving. In particular, a broad privacy law in California, the California Consumer Privacy Act (“CCPA”), which came into effect in January 2020 and was amended by the California Privacy Rights Act effective January 2023, has some of the same features as the GDPR (discussed below) and has prompted several other states to enact or consider similar legislation.
9
Across the European Economic Area, the General Data Protection Regulation (“GDPR”), and similar laws in the United Kingdom and Switzerland impose strict requirements on how we process personal data, including, among other things, in certain circumstances a requirement for prompt notification of data breaches to supervisory authorities and/or to data subjects, with the risk of significant fines for non-compliance. Regulators throughout Europe also require additional safeguards to facilitate the transfer of personal information outside of Europe.
Several other countries, such as China, Russia, and Brazil, have passed, and other countries are considering passing, laws that meaningfully expand the compliance requirements around confidential, personal, and/or sensitive data that we may have access to or process in the course of our business. In China and Russia, privacy and security laws may require a copy of personal data relating to citizens to be maintained on local servers and impose additional data transfer restrictions. Brazil’s Lei Geral de Proteção de Dados (“LGPD”) increases compliance requirements related to privacy, data protection, and information security for businesses that are located or do business within Brazil. Although the LGPD shares similarities with the GDPR, it also contains a number of unique features, including specific legal bases not found in the GDPR that allow an organization to process personal data and specific requirements for the role or appointment of a data protection officer. In these countries and elsewhere, the laws applicable to data privacy and security may require changes to business practices or additional investment for compliance purposes.
Environmental Laws and Regulations
Our operations and properties are subject to laws and regulations relating to environmental protection, including those governing air emissions, water discharges and waste management, and workplace health and safety. For a discussion of the environmental laws and regulations that our operations, products, and services are subject to and other environmental contingencies, please refer to Note 12 to the consolidated financial statements included in this Annual Report. For a discussion of risks related to compliance with environmental and health and safety laws and risks related to past or future releases of, or exposures to, hazardous substances, please refer to “Item 1A. Risk Factors.”
Export/Import Regulations
We sell products and services to customers all over the world and are required to comply with various U.S. export/import control and economic sanctions laws, such as:
•the International Traffic in Arms Regulations administered by the U.S. Department of State, Directorate of Defense Trade Controls, which, among other things, impose license requirements on the export from the United States of defense articles and defense services listed on the United States Munitions List;
•the Export Administration Regulations administered by the U.S. Department of Commerce, Bureau of Industry and Security, which, among other things, impose licensing requirements on the export, in-country transfer, and re-export of certain dual-use goods, technology, and software (which are items that have both commercial and military or proliferation applications);
•the regulations administered by the U.S. Department of Treasury, Office of Foreign Assets Control, which implement economic sanctions imposed against designated countries, governments, and persons based on United States foreign policy and national security considerations; and
•the import regulations administered by U.S. Customs and Border Protection.
Other nations’ governments have implemented similar export/import control and economic sanction regulations, which may affect our operations or transactions subject to their jurisdictions. Together these controls and regulations may impose licensing requirements on exports of certain technology and software from the U.S. and may impact our ability to transact business in certain countries or with certain customers. We have developed compliance programs and training to prevent violations of these programs and regulations, and we regularly monitor changes in the law and regulations. Changes in these or other import or export laws and regulations may restrict or further restrict our ability to sell certain products and solutions and may require us to develop additional compliance programs and training. For a discussion of risks related to export/import control and economic sanctions laws, please refer to “Item 1A. Risk Factors.”
Competition Laws
Our global operations are subject to complex and changing antitrust and competition laws and regulations, including conflicting laws and regulations in different jurisdictions that have increased the cost of conducting our global operations. We have implemented policies and procedures designed to ensure compliance with applicable global laws and regulations, but there can be no assurance of complete and consistent compliance with all laws and regulations given the complex and evolving policies implemented by governments around the world. If we are found to have violated laws and regulations, it could materially adversely affect our business, reputation, results of operations and financial condition.
10
Whistleblower Laws
We operate in jurisdictions, such as the U.S. and European Union, with significant legal protection compliance for whistleblowers who make compliance reports about potential violations internally and to government authorities. Non-compliance with the Whistleblower Directive can result in fines and other penalties against entities. In the U.S., the Securities and Exchange Commission and the Department of Justice can provide monetary awards to whistleblowers that report securities law violations that are subsequently pursued. U.S. laws, such as the False Claims Act, also include strong financial incentives for whistleblowers to bring lawsuits against companies with healthcare products and services such as Fortive. In addition, the False Claims Act permits whistleblowers to bring a lawsuit on behalf of the government and share in any monetary recovery, even if the government decides not to intervene in the case.
International Operations
Our products and services are available in markets worldwide, and our principal markets outside the United States are in Europe and Asia. We also have operations around the world, and this geographic diversity allows us to draw on the skills of a worldwide workforce, provides greater stability to our operations, allows us to drive economies of scale, provides revenue streams that may help offset economic trends that are specific to individual economies, and offers us an opportunity to access new markets for products. In addition, we believe that our future growth depends in part on our ability to continue developing products and sales models that successfully target high-growth markets.
The manner in which our products and services are sold outside the United States differs by business and by region. Most of our sales in non-U.S. markets are made by our subsidiaries located outside the United States, though we also sell directly from the United States into non-U.S. markets through various representatives and distributors and, in some cases, directly. In countries with low sales volumes, we generally sell through representatives and distributors.
Available Information
We maintain an internet website at www.fortive.com where we make available free of charge our annual reports on Form 10-K, quarterly reports on Form 10-Q, and current reports on Form 8-K and amendments to those reports, filed or furnished pursuant to Section 13(a) or 15(d) of the Exchange Act, as soon as reasonably practicable after filing such material with, or furnishing such material to, the SEC. Our internet website and the information contained in, or linked from, that website are not incorporated by reference into this Form 10-K.
ITEM 1A. RISK FACTORS
You should carefully consider the risks and uncertainties described below, together with the information included elsewhere in this Annual Report on Form 10-K and other documents we file with the SEC. The risks and uncertainties described below are those that we have identified as material, but are not the only risks and uncertainties facing us. Our business is also subject to general risks and uncertainties that affect many other companies, such as market conditions, economic conditions, geopolitical events, changes in laws, regulations, or accounting rules, fluctuations in interest rates, terrorism, wars or conflicts, major health concerns, natural disasters, or other disruptions of expected business conditions. Additional risks and uncertainties not currently known to us or that we currently believe are immaterial also may impair our business, including our results of operations, liquidity, and financial condition.
Risk Related to Our Business Operations
Conditions in the global economy, the markets we serve, and the financial markets may adversely affect our business and financial results.
Our business is impacted by general economic conditions, and adverse economic conditions arising from any slower global economic growth, reduced demand or consumer confidence, energy, manufacturing or component supply constraints arising from international conflicts, high inflation rates and the corresponding interest rate policies, volatility in currency and credit markets, actual or anticipated default on sovereign debt, changes in global trade policies, unemployment and underemployment rates, immigration policies, reduced levels of capital expenditures, changes in government fiscal and monetary policies, political initiatives targeted at reducing government funding, government deficit reduction and budget negotiation dynamics, sequestration, other austerity measures, political and social instability, other geopolitical conflict, sanctions, natural disasters, public health crises, terrorist attacks, and other challenges affect us and our distributors, customers, and suppliers, including having the effect of:
•reducing demand for our products, software, and services, limiting the financing available to our customers and suppliers, increasing order cancellations, and resulting in longer sales cycles and slower adoption of new technologies;
•increasing the difficulty in collecting accounts receivable and the risk of excess and obsolete inventories;
11
•increasing price competition in our served markets;
•supply interruptions, which could disrupt our ability to produce our products;
•increasing the risk of impairment of goodwill and other long-lived assets, and the risk that we may not be able to fully recover the value of other assets such as real estate and tax assets;
•increasing the impact of currency translation; and
•increasing the risk that counterparties to our contractual arrangements will become insolvent or otherwise unable to fulfill their contractual obligations which, in addition to increasing the risks identified above, could result in preference actions against us.
In addition, adverse general economic conditions may lead to instability in U.S. and global capital and credit markets, including market disruptions, limited liquidity, and interest rate volatility. If we are unable to access capital and credit markets on terms that are acceptable to us or our lenders are unable to provide financing in accordance with their contractual obligations, we may not be able to make certain investments or acquisitions or fully execute our business plans and strategies. Furthermore, our suppliers and customers are also dependent upon the capital and credit markets. Limitations on the ability of customers, suppliers, or financial counterparties to access credit at interest rates and on terms that are acceptable to them could lead to insolvencies of key suppliers and customers, limit or prevent customers from obtaining credit to finance purchases of our products and services, and cause delays in the delivery of key products from suppliers.
If growth in the global economy or in any of the markets we serve slows for a significant period, if there is significant deterioration in the global economy or such markets, if there is instability in global capital and credit markets, or if improvements in the global economy do not benefit the markets we serve, our business and financial results would be adversely affected.
If we cannot adjust our manufacturing capacity, supply chain management or the purchases required for our manufacturing activities to reflect changes in market conditions, international trade policies, customer demand and supply chain disruptions, our profitability may suffer. In addition, our reliance upon sole or limited sources of supply for certain materials, components, and services could cause production interruptions, delays and inefficiencies.
We purchase materials, components, and equipment from third parties for use in our manufacturing operations. Our income could be adversely impacted if we are unable to adjust our purchases and supply chain management to reflect any supply chain or transportation disruptions or changes in customer demand and market fluctuations, geopolitical disruptions, severe weather events, increases in demand outpacing supply capabilities, labor shortages, seasonality or cyclicality. During a market upturn or general supply chain disruptions, suppliers have extended lead times, limited supplies, or increased prices. If we cannot purchase sufficient products at competitive prices and quality and on a timely enough basis to meet demand for our products, we may not be able to satisfy market demand, product shipments may be delayed, our costs may increase, or we may breach our contractual commitments and incur liabilities.
Conversely, in order to secure supplies for the production of products, we sometimes enter into noncancelable purchase commitments with vendors, which could impact our ability to adjust our inventory to reflect declining market demands. If demand for our products is less than we expect, we may experience additional excess and obsolete inventories and be forced to incur additional charges and our profitability may suffer.
In addition, some of our businesses purchase certain requirements from sole or limited source suppliers for reasons of quality assurance, cost effectiveness, availability, contractual obligations or uniqueness of design. If these or other suppliers encounter financial, operating, quality, or other difficulties or if our relationship with them changes, including as a result of contractual disputes, we might not be able to quickly establish or qualify replacement sources of supply. The supply chains for our businesses could also be disrupted by supplier capacity constraints, operational or quality issues, bankruptcy or exiting of the business for other reasons, decreased availability of key raw materials or commodities, and external events such as natural disasters, severe weather events that are occurring more frequently or with more intense effects as a result of global climate change, public health crises, war, terrorist actions, governmental actions, and legislative or regulatory changes, among others. Any of these factors could result in production interruptions, delays, extended lead times, and inefficiencies.
Because we cannot always immediately adapt our production capacity and related cost structures to changing market conditions, our manufacturing capacity may at times exceed or fall short of our production requirements. Any or all of these problems could result in the loss of customers, provide an opportunity for competing products to gain market acceptance, and otherwise adversely affect our profitability.
12
Our financial results are subject to fluctuations in the cost and availability of commodities or components that we use in our operations.
As discussed in the section entitled “Business—Materials,” our manufacturing and other operations employ a wide variety of components, raw materials, and other commodities. Prices for and availability of these components, raw materials, and other commodities have fluctuated significantly in the past. In particular, the widespread supply chain challenges due to labor, raw material, and component shortages, as well as widespread logistics issues, affected multiple industries, raised material and shipping costs, limited the quantities available, and extended the lead time required for supplies and deliveries. Any sustained interruption in the supply of these items, including as a result of general supply chain constraints, increasing demand outpacing supplies, or contractual disputes with suppliers or vendors, could adversely affect our business. In addition, due to the highly competitive nature of the industries that we serve, the cost-containment efforts of our customers, and the terms of certain contracts we are party to, if commodity or component prices rise we may be unable to pass along cost increases through higher prices. If we are unable to fully recover higher commodity or component costs through price increases or offset these increases through cost reductions, or if there is a time delay between the increase in costs and our ability to recover or offset these costs, we could experience lower margins and profitability and our financial results could be adversely affected.
Our growth could suffer if the markets into which we sell our products and services decline, do not grow as anticipated, or experience cyclicality.
Our growth depends in part on the growth of the markets which we serve, and visibility into our markets is limited (particularly for markets into which we sell through distribution). Our quarterly sales and profits depend substantially on the volume and timing of orders received during the fiscal quarter, which are difficult to forecast. Any decline or lower than expected growth in our served markets could diminish demand for our products and services, which could adversely affect our financial results. Certain of our businesses operate in industries that may experience periodic, cyclical downturns. In addition, in certain of our businesses, demand depends on customers’ capital spending budgets, and product and economic cycles can affect the spending decisions of these entities. Demand for our products and services is also sensitive to changes in customer order patterns, which may be affected by announced price changes, changes in incentive programs, new product introductions, and customer inventory levels. Any of these factors could adversely affect our growth and results of operations in any given period.
We face intense competition and if we are unable to compete effectively, we may experience decreased demand and decreased market share. Even if we compete effectively, we may be required to reduce prices for our products and services.
Many of our businesses operate in industries that are intensely competitive and have been subject to consolidation. Because of the range of the products and services we sell and the variety of markets we serve, we encounter a wide variety of competitors. See “Business—Competition.” In order to compete effectively, we must retain longstanding relationships with major customers and continue to grow our business by establishing relationships with new customers, continually developing new or enhanced products and services to maintain and expand our brand recognition and leadership position in various product and service categories, and penetrating new markets, including high-growth markets. Our failure to compete effectively and/or pricing pressures resulting from competition may adversely impact our financial results, and our expansion into new markets may result in greater-than-expected risks, liabilities and expenses.
Our growth depends in part on the timely development, commercialization and customer acceptance of new and enhanced products and services based on technological innovation.
We generally sell our products and services in industries that are characterized by rapid technological changes, frequent new product introductions and changing industry standards. If we do not develop innovative new and enhanced products and services on a timely basis, our offerings will become obsolete over time and our competitive position and financial results will suffer. Our success will depend on several factors, including our ability to:
•accurately identify customer needs and preferences and predict future needs and preferences;
•allocate our research and development funding to products and services with higher growth prospects;
•anticipate and respond to our competitors’ development of new products and services and technological innovations;
•differentiate our offerings from our competitors’ offerings and avoid commoditization;
•innovate and develop new technologies and applications, and acquire or obtain rights to third-party technologies that may have valuable applications in our served markets;
•obtain adequate intellectual property rights with respect to key technologies before our competitors do;
•successfully commercialize new technologies in a timely manner, price them competitively, and cost-effectively manufacture and deliver sufficient volumes of new products of appropriate quality on time; and
•stimulate customer demand for and convince customers to adopt new technologies.
13
In addition, if we fail to accurately predict future customer needs and preferences or fail to produce viable technologies, we may invest heavily in research and development of products and services that do not lead to significant revenue, which would adversely affect our profitability. Even if we successfully innovate and develop new and enhanced products and services, we may incur substantial costs in doing so, and our profitability may suffer.
Our ability to successfully manage our leadership transition in connection with the completed Separation and attract, develop, and retain senior leaders and other key employees is critical to our success.
In connection with the Separation and as part of our long-term succession planning, we transitioned each of our Chief Executive Officer, Chief Financial Officer, and Chief People Officer roles in 2025 and early 2026. Our future performance is dependent upon our ability to manage successfully the leadership transitions and continue to attract, motivate and retain key leaders and other key employees. Unplanned loss of services of executives and other key employees or the failure to attract, motivate and develop new executives or other key employees could prevent us from successfully implementing and executing business strategies, and therefore adversely affect our financial results.
Our success also depends on our ability to attract, develop and retain a talented employee base. Our brand, our culture, our ability to provide competitive compensation, our locations of operations, and our reputation are important to our ability to recruit and retain key employees in these competitive markets. If we are not competitive or successful in our recruiting efforts, if we cannot attract or retain key employees, if we do not adequately ensure effective succession planning or transfer of knowledge for our key employees, or if some of our key employees are unable to enter, or choose to leave, the United States given uncertainties relating to immigration laws or immigration enforcement actions, our ability to deliver and execute on our operational, development, or portfolio strategies would be adversely affected.
Disruptions in, or breaches in security of, our information technology systems, exfiltration of confidential or sensitive data, and other cyberattacks have adversely affected, and in the future could adversely affect, our business.
We collect, store, have access to and otherwise process certain confidential or sensitive data, including proprietary business information, customer data, personal data, and other information that is subject to privacy and security laws, regulations and/or customer-imposed controls. We rely on information technology systems, some of which are managed by third parties and some of which are managed on a decentralized, independent basis by our operating companies, to process, transmit, and store electronic information (including sensitive data such as confidential business information and personally identifiable data relating to employees, customers, and other business partners), and to manage or support a variety of critical business processes and activities. These systems can be, and in the past have been, damaged, disrupted, accessed, or shut down due to attacks by computer hackers, nation states, cyber-criminals, computer viruses, error or malfeasance by employee or former employees, power outages, hardware failures, telecommunication or utility failures, catastrophes, or other similar events, and in any such circumstances our system redundancy and other disaster recovery planning may be ineffective or inadequate. In addition, security breaches of our systems or lack of sufficient control in our systems (or the systems of our customers, suppliers or other business partners) could result, and have resulted, in the misappropriation, change, destruction, exfiltration or unauthorized disclosure of confidential information or personal data belonging to us or to our employees, partners, customers, or suppliers. Like many multinational corporations, our information technology systems have been subject to computer viruses, malicious codes, and other cyber-attacks that have resulted in disruption of our operations, unauthorized access to confidential information and increased the cost of operations through containment, investigation and remediation efforts. Furthermore, we expect to be subject to similar incidents in the future as such attacks become more sophisticated and frequent, any of which may have a material adverse impact on our business continuity, operations or financial results. Increasing use of artificial intelligence may increase these risks. Any of the attacks, breaches, or other disruptions or damage described above, as well as corresponding investigation, containment, and remediation efforts, can disrupt our operations, delay production and shipments, result in theft of our and our customers’ intellectual property and trade secrets, disclosure of personal data, damage customer and business partner relationships and our reputation, or result in defective products or services, legal claims and proceedings, liability and penalties under privacy laws, and increased costs for security and remediation, each of which could adversely affect our business and financial results.
Defects and unanticipated use or inadequate disclosure with respect to our products (including software) or services could adversely affect our business, reputation, and financial results.
Manufacturing or design defects impacting safety, cybersecurity, or quality issues (or the perception of such issues) for our products and services can lead to personal injury, death, property damage, data loss, or other damages. These events could lead to recalls or safety or other public alerts, result in product or service downtime or the temporary or permanent removal of a product or service from the market and result in product liability or similar claims being brought against us. Recalls, downtime, removals, and product liability and similar claims (regardless of their validity or ultimate outcome) can result in significant costs, as well as negative publicity and damage to our reputation that could reduce demand for our products and services.
14
Adverse changes in our relationships with, or the financial condition, performance, purchasing patterns, or inventory levels of, key distributors and other channel partners could adversely affect our financial results.
Certain of our businesses sell a significant amount of their products to key distributors and other channel partners that have valuable relationships with customers and end-users. Some of these distributors and other partners also sell our competitors’ products or compete with us directly, and if they favor competing products for any reason they may fail to market our products effectively. Adverse changes in our relationships with these distributors and other partners, or adverse developments in their financial condition, performance, or purchasing patterns, could adversely affect our financial results. The levels of inventory maintained by our distributors and other channel partners, and changes in those levels, can also significantly impact our results of operations in any given period. In addition, the consolidation of distributors and customers in certain of the industries in which we operate could adversely impact our profitability.
Work stoppages, works council campaigns, and other labor disputes could adversely impact our productivity and results of operations.
We have various non-U.S. collective labor arrangements. We are subject to potential work stoppages, works council campaigns, and other labor disputes, any of which could adversely impact our productivity, results of operations, and reputation.
If we suffer loss to our facilities, supply chains, distribution systems, or information technology systems due to catastrophe or other events, our operations could be seriously harmed.
Our facilities, supply chains, distribution systems, and information technology systems are subject to catastrophic loss due to fire, flood, earthquake, hurricane, public health crises, war, terrorism, or other natural or man-made disasters, including those caused by climate change and other climate-related causes. If any of these facilities, supply chains, or systems were to experience a catastrophic loss, it could disrupt our operations, delay production and shipments, result in defective products or services, damage customer relationships and our reputation, and result in legal exposure and large repair or replacement expenses. The third-party insurance coverage that we maintain will vary from time to time in both type and amount depending on cost, availability, and our decisions regarding risk retention, and may be unavailable or insufficient to protect us against losses.
If we do not or cannot adequately protect our intellectual property, or if third parties infringe our intellectual property rights, we may suffer competitive injury or expend significant resources enforcing our rights.
We own numerous patents, trademarks, copyrights, trade secrets, and other intellectual property and have licenses to intellectual property owned by others, which in aggregate are important to our business. The intellectual property rights that we obtain, however, may not be sufficiently broad or otherwise may not provide us a significant competitive advantage, and patents may not be issued for pending or future patent applications owned by or licensed to us. In addition, the steps that we and our licensors have taken to maintain and protect our intellectual property may not prevent it from being challenged, invalidated, circumvented, designed-around, or becoming subject to compulsory licensing, particularly in countries where intellectual property rights are not highly developed or protected. In some circumstances, enforcement may not be available to us because an infringer has a dominant intellectual property position or for other business reasons, or countries may require compulsory licensing of our intellectual property. We also rely on nondisclosure and noncompetition agreements with employees, consultants, and other parties to protect, in part, trade secrets and other proprietary rights. There can be no assurance that these agreements will adequately protect our trade secrets and other proprietary rights and will not be breached, that we will have adequate remedies for any breach, that others will not independently develop substantially equivalent proprietary information, or that third parties will not otherwise gain access to our trade secrets or other proprietary rights. Our failure to obtain or maintain intellectual property rights that convey competitive advantage, adequately protect our intellectual property or detect or prevent circumvention or unauthorized use of such property, and the cost of enforcing our intellectual property rights could adversely impact our business, including our competitive position, and financial results.
Third parties may claim that we are infringing or misappropriating their intellectual property rights and we could suffer significant litigation expenses, losses, or licensing expenses or be prevented from selling products or services.
From time to time, we receive notices from third parties alleging intellectual property infringement or misappropriation. Any dispute or litigation regarding intellectual property could be costly and time-consuming due to the complexity of many of our technologies and the uncertainty of intellectual property litigation. Our intellectual property portfolio may not be useful in asserting a counterclaim, or negotiating a license, in response to a claim of infringement or misappropriation. In addition, as a result of such claims of infringement or misappropriation, we could lose our rights to critical technology, be unable to license critical technology or sell critical products and services, be required to pay substantial damages or license fees with respect to the infringed rights, be required to license technology or other intellectual property rights from others, be required to cease marketing, manufacturing, or using certain products, or be required to redesign, re-engineer, or re-brand our products at
15
substantial cost, any of which could adversely impact our competitive position and financial results. Third-party intellectual property rights may also make it more difficult or expensive for us to meet market demand for particular product or design innovations. If we are required to seek licenses under patents or other intellectual property rights of others, we may not be able to acquire these licenses on acceptable terms, if at all. Even if we successfully defend against claims of infringement or misappropriation, we may incur significant costs and diversion of management attention and resources, which could adversely affect our business and financial results.
Our restructuring activities could have long-term adverse effects on our business.
We have implemented, and may continue to implement significant restructuring activities across our businesses to adjust our cost structure, including restructuring activities relating to our recent separation of Ralliant. These significant restructuring activities as well as our regular ongoing cost reduction activities (including in connection with the integration of acquired businesses) reduce our available talent, assets, and other resources and could slow improvements in our products and services, adversely affect our ability to respond to customers and limit our ability to increase production quickly if demand for our products increases. In addition, delays in implementing planned restructuring activities or other productivity improvements, unexpected costs, or failure to meet targeted improvements may diminish the operational or financial benefits we realize from such actions. Any of the circumstances described above could adversely impact our business and financial results.
We are subject to a variety of litigation and other legal and regulatory proceedings in the course of our business that could adversely affect our financial results.
We are subject to a variety of litigation and other legal and regulatory proceedings incidental to our business (or the business operations of previously owned entities), including claims for damages arising out of the use of products or services and claims relating to intellectual property matters, employment matters, tax matters, commercial disputes, disputes with our suppliers or vendors, competition and sales and trading practices, environmental matters, personal injury, insurance coverage, and acquisition or divestiture-related matters, as well as regulatory investigations or enforcement. We may also become subject to lawsuits as a result of past or future acquisitions or as a result of liabilities retained from, or representations, warranties, or indemnities provided in connection with, divested businesses. These lawsuits may include claims for compensatory damages, punitive and consequential damages, and/or injunctive relief. The defense of these lawsuits may divert our management’s attention, we may incur significant expenses in defending these lawsuits, we may experience disruption in supply or sales, and we may be required to pay damage awards or settlements or become subject to equitable remedies that could adversely affect our operations and financial results. Moreover, any insurance or indemnification rights that we may have may be insufficient or unavailable to protect us against such losses. In addition, developments in proceedings in any given period may require us to adjust the loss contingency estimates that we have recorded in our financial results, record estimates for liabilities or assets that we were previously unable to estimate, or pay cash settlements or judgments. Any of these developments could adversely affect our financial results in any particular period. We cannot assure you that our liabilities in connection with litigation and other legal and regulatory proceedings will not exceed our estimates or adversely affect our financial results and reputation.
Climate change, or legal or regulatory measures to address climate change, may negatively affect us.
Climate change resulting from increased concentrations of carbon dioxide and other greenhouse gases in the atmosphere could present risks to our operations. Physical risk resulting from acute changes (such as hurricane, tornado, wildfire or flooding) or chronic changes (such as droughts, heat waves or sea level changes) in climate patterns can adversely impact our facilities and operations and disrupt our supply chains and distribution systems. Concern over climate change can also result in new or additional legal or regulatory requirements designed to reduce greenhouse gas emissions and/or mitigate the effects of climate change on the environment (such as taxation of, or caps on the use of, carbon-based energy). Any such new or additional legal or regulatory requirements, including extensive disclosure requirements in various jurisdictions, including in the E.U. and domestically, may increase the costs associated with, or disrupt, sourcing, manufacturing and distribution of our products, which may adversely affect our business and financial results. In addition, any failure to adequately address stakeholder expectations with respect to environmental, social and governance matters may result in the loss of business, adverse reputational impacts, diluted market valuations and challenges in attracting and retaining customers and talented employees.
We use artificial intelligence in our business and in certain of our products, and challenges with properly managing its use could result in reputational harm, competitive harm, and legal liability, and adversely affect our results of operations.
We incorporate artificial intelligence (“AI”) solutions into certain of our products, services and features, and we have leveraged AI, including generative AI, in our product development, our operations, and our software programming. Our competitors or other third parties may incorporate AI into their products or operational processes more quickly or more successfully than us, which could impair our ability to compete effectively and adversely affect our results of operations.
16
In addition, there are significant risks involved in developing and deploying AI and there can be no assurance that the usage of AI will enhance our products or services or be beneficial to our business, including our efficiency or profitability. For example, our AI-related efforts, particularly those related to generative AI, subject us to risks related to accuracy, intellectual property infringement or misappropriation, data privacy, and cybersecurity, among others. It is also uncertain how various laws related to online services, intermediary liability, and other issues will apply to content generated by AI. AI also presents emerging ethical issues, and if our use of AI becomes controversial, we may experience brand or reputational harm, competitive harm, or legal liability. The rapid evolution of AI, including the regulation of AI by government or other regulatory agencies, will require significant resources to develop, test and maintain our platforms, offerings, services, and features to implement AI ethically and minimize any unintended harmful impacts.
Risk Related to our International Operations
International economic, political, legal, compliance, and business factors could negatively affect our financial results.
In 2025, approximately 44% of our sales were derived from customers outside the United States. Our principal markets outside the United States are in Europe and Asia. In addition, many of our manufacturing operations, suppliers, and employees are located outside the United States. Since our growth strategy depends in part on our ability to further penetrate markets outside the United States and increase the localization of our products and services, we expect to continue to increase our sales and presence outside the United States, particularly in high-growth markets, such as Eastern Europe, the Middle East, Africa, Latin America, and Asia. Regional conflicts, including the Russian invasion of Ukraine, conflict in the Middle East, tension between China and Taiwan, could result in sanctions, regional market instability, increased energy and transportation costs, and other adverse regional financial and economic conditions, any of which can impact the demand for, or our ability to sell, our products and services in the impacted regions. Furthermore, our international business, including our business in high-growth markets outside the United States, is subject to additional risks that are customarily encountered in non-U.S. operations, as well as increased risks due to significant uncertainties related to political and economic changes, including:
•interruption in the transportation of materials to us and finished goods to our customers;
•differences in terms of sale, including payment terms;
•local product preferences and product requirements;
•changes in a country’s or region’s political or economic conditions, including changes in relationship with the United States;
•trade protection measures, sanctions, increased trade barriers, imposition of significant tariffs on imports or exports, embargoes, and import or export restrictions and requirements;
•new conditions to, and possible restrictions of, existing free trade agreements;
•epidemics, such as the coronavirus outbreak, that adversely impact travel, production, or demand;
•unexpected changes in laws or regulatory requirements, including negative changes in tax laws in the U.S. and in countries in which we manufacture or sell our products;
•limitations on ownership and on repatriation of earnings and cash;
•the potential for nationalization of enterprises;
•limitations on legal rights and our ability to enforce such rights;
•difficulty in staffing and managing widespread operations;
•differing labor regulations;
•difficulties in implementing restructuring actions on a timely or comprehensive basis; and
•differing protection of intellectual property.
Any of these risks could negatively affect our financial results and growth rate.
Trade relations between the United States and other countries have been volatile and could have a material adverse effect on our business and financial results.
We participate in various end markets outside the United States. During 2025, sales outside the United States accounted for approximately 44% of our total sales for the year. In addition, we have several facilities outside the United States, many of which serve multiple Fortive operating companies in manufacturing, distribution, product design, and selling, general and administrative functions.
Recent economic, foreign and political policies and enforcement actions, including trade restrictions, withdrawal from global trade agreements, uncertainty relating to the future rate or enforceability of tariffs and reciprocal tariffs, including as a result of the recent ruling by the Supreme Court of the United States invalidating certain tariffs previously imposed under the
17
International Emergency Economic Powers Act (“the IEEPA Ruling”), changes to immigration laws or enforcement, uncertainty relating to availability of refunds on tariffs that have been invalidated, expectations or actions of customers, suppliers and other distribution or supply chain partners on pricing or costs as a result of the IEEPA Ruling, uncertainty relating to the status of prior trade agreements between the United States and other countries that had been adopted in response to tariffs that have subsequently been invalidated by the IEEPA Ruling, and other similar actions may result in increased transaction and operating costs, adverse regional and global economic conditions, reduced ability to attract talent, supply chain constraints, responsive economic and nationalism outside the United States, and volatile regulatory environment, any of which may adversely affect our business or demand for our products and services.
As a result, there continues to be significant uncertainty about, and volatility in, the future relationship between the United States and other countries, especially with respect to trade policies, treaties, government regulations, sanctions and tariffs. In particular, there continues to be uncertainty about U.S. foreign trade policy with respect to China, including any changes to the trade policies that have been adopted, and that may result from the IEEPA Ruling, including any alternative legislative or executive actions that may be adopted to reimpose similar tariffs. Any increased sanctions, tariffs, other trade barriers or restrictions or uncertainty on global trade adopted by or against the United States could adversely impact our business and financial results.
Foreign currency exchange rates, including the volatility thereof, may adversely affect our financial results.
Sales and purchases in currencies other than the U.S. dollar expose us to fluctuations in foreign currencies relative to the U.S. dollar and may adversely affect our financial results. Overall strengthening of the U.S. dollar during most of fiscal year 2025 has increased the effective price of our products sold in U.S. dollars into other countries, which may require us to lower our prices or adversely affect sales to the extent we do not increase local currency prices. Decreased strength of the U.S. dollar could adversely affect the cost of materials, products and services we purchase overseas. Sales and expenses of our non-U.S. businesses are also translated into U.S. dollars for reporting purposes and the strengthening or weakening of the U.S. dollar could result in unfavorable translation effects. In addition, certain of our businesses transact in a currency other than the business’s functional currency, and movements in the transaction currency relative to the functional currency could also result in unfavorable exchange rate effects. We also face exchange rate risk from our investments in subsidiaries owned and operated in foreign countries and borrowings denominated in foreign currencies.
Risk Related to Our Investments and Dispositions
Our strategy requires us to execute and deliver disciplined capital allocation.
Our Fortive Accelerated strategy requires us to execute and deliver disciplined capital allocation, including investments in organic growth, identifying and successfully acquiring businesses at appropriate prices, and to make other appropriate investments that support our long-term strategy. In particular, acquisitions and investments that align with our portfolio strategy may be difficult to identify and execute for a number of reasons, including high valuations, competition among prospective buyers, the availability of affordable funding in the capital markets and the need to satisfy applicable closing conditions and obtain antitrust and other regulatory approvals on acceptable terms. Changes in accounting or regulatory requirements or instability in the credit markets could also adversely impact our ability to consummate acquisitions and investments.
Our acquisition of businesses, investments, joint ventures, and other strategic relationships could negatively impact our financial results.
As part of our business strategy we acquire businesses, make investments, and enter into joint ventures and other strategic relationships in the ordinary course, some of which may be material; please refer to “Management’s Discussion and Analysis of Financial Condition and Results of Operations” for additional details. These acquisitions, investments, joint ventures, and strategic relationships involve a number of financial, accounting, managerial, operational, legal, compliance, and other risks and challenges, including the following, any of which could adversely affect our financial results:
•any business, technology, service, or product that we acquire or invest in could under-perform relative to our expectations and the price that we paid for it, or not perform in accordance with our anticipated timetable, or we could fail to operate any such business profitably;
•we may incur or assume significant debt in connection with our acquisitions, investments, joint ventures, or strategic relationships, which could also cause a deterioration of our credit ratings, result in increased borrowing costs and interest expense, and diminish our future access to the capital markets;
•acquisitions, investments, joint ventures, or strategic relationships could cause our financial results to differ from our own or the investment community’s expectations in any given period, or over the long-term;
•pre-closing and post-closing earnings charges could adversely impact operating results in any given period, and the impact may be substantially different from period to period;
18
•acquisitions, investments, joint ventures, or strategic relationships could create demands on our management, operational resources, and financial and internal control systems that we are unable to effectively address;
•we could experience difficulty in integrating personnel, operations, and financial and other controls and systems and retaining key employees and customers;
•we may be unable to achieve cost savings or other synergies anticipated in connection with an acquisition, investment, joint venture, or strategic relationship;
•we may assume by acquisition or strategic relationship unknown liabilities, known contingent liabilities that become realized, known liabilities that prove greater than anticipated, internal control deficiencies, or exposure to regulatory sanctions resulting from the acquired company’s or investee’s activities and the realization of any of these liabilities or deficiencies may increase our expenses, adversely affect our financial position, or cause us to fail to meet our public financial reporting obligations;
•in connection with acquisitions and joint ventures, we may enter into post-closing financial arrangements such as purchase price adjustments, earn-out obligations, and indemnification obligations, which may have unpredictable financial results;
•in connection with acquisitions and investments, we have recorded significant goodwill and other intangible assets on our balance sheet and if we are not able to realize the value of these assets, we may be required to incur charges relating to the impairment of these assets; and
•we may have interests that diverge from those of our joint venture partners or other strategic partners and we may not be able to direct the management and operations of the joint venture or other strategic relationship in the manner we believe is most appropriate, exposing us to additional risk.
The indemnification provisions of acquisition agreements by which we have acquired companies may not fully protect us and as a result we may face unexpected liabilities.
Certain of the acquisition agreements by which we have acquired companies require the former owners to indemnify us against certain liabilities related to the operation of the company before we acquired it. In most of these agreements, however, the liability of the former owners is limited and certain former owners may be unable to meet their indemnification responsibilities. We cannot assure you that these indemnification provisions will protect us fully or at all, and as a result we may face
unexpected liabilities that adversely affect our financial results.
Divestitures or other dispositions could negatively impact our business, and contingent liabilities from businesses that we have sold could adversely affect our financial results.
We continually assess the strategic fit of our existing businesses and may divest or otherwise dispose of businesses that are deemed not to fit with our strategic plan or are not achieving the desired return on investment. For example, in 2018, we split-off most of our automation and specialty platform in a Reverse Morris Trust transaction with Altra Industrial Motion Corp. and, in 2020 and 2025, we spun-off our former Industrial Technologies segment and our former Precision Technologies segment, respectively. These transactions pose risks and challenges that could negatively impact our business. For example, when we decide to sell or otherwise dispose of a business or assets, we may be unable to do so on satisfactory terms within our anticipated timeframe or at all, and even after reaching a definitive agreement to sell or dispose a business the sale is typically subject to satisfaction of pre-closing conditions which may not become satisfied. In addition, divestitures or other dispositions may dilute our earnings per share, have other adverse financial and accounting impacts and distract management, and disputes may arise with buyers. In addition, we have retained responsibility for and/or have agreed to indemnify buyers against some known and unknown contingent liabilities related to a number of businesses we have sold or disposed of. The resolution of these contingencies has not had a material effect on our financial results but we cannot be certain that this favorable pattern will continue.
Potential indemnification liabilities to Ralliant and Vontier pursuant to the respective separation agreements could materially and adversely affect our businesses, financial condition, results of operations, and cash flows.
We entered into a separation and distribution agreement and related agreements with Vontier and with Ralliant to govern the separation and distribution of Vontier and Ralliant, respectively, and the relationship between each of the two companies and Fortive going forward. These agreements provide for specific indemnity and liability obligations of each party and could lead to disputes between us. If we are required to indemnify Vontier or Ralliant under the circumstances set forth in these agreements, we may be subject to substantial liabilities. In addition, with respect to the liabilities for which Vontier or Ralliant has agreed to indemnify us under these agreements, there can be no assurance that the indemnity rights we have against Vontier or Ralliant, as applicable, will be sufficient to protect us against the full amount of the liabilities, or that Vontier and Ralliant will be able to fully satisfy its indemnification obligations. Each of these risks could negatively affect our businesses, financial condition, results of operations, and cash flows.
19
Risk Related to Regulatory and Compliance Matters
Changes in industry standards and governmental regulations may reduce demand for our products or services or increase our expenses.
We compete in markets in which we and our customers must comply with supranational, federal, state, local, and other jurisdictional regulations, such as regulations governing health and safety, the environment, and electronic communications, and market standardizations. We develop, configure, and market our products and services to meet customer needs created by these regulations and standards. These regulations and standards are complex, change frequently, have tended to become more stringent over time, and may be inconsistent across jurisdictions. Any significant change or delay in implementation in any of these regulations or standards (or in the interpretation, application, or enforcement thereof) could reduce or delay demand for our products and services, increase our costs of producing or delay the introduction of new or modified products and services, or restrict our existing activities, products, and services. In addition, in certain of our markets our growth depends in part upon the introduction of new regulations or implementation of industry standards on the timeline we expect. In these markets, the delay or failure of governmental and other entities to adopt or enforce new regulations or industry standards, or the adoption of new regulations or industry standards which our products and services are not positioned to address, could adversely affect demand. In addition, regulatory deadlines or industry standard implementation timelines may result in substantially different levels of demand for our products and services from period to period.
Our reputation, ability to do business, and financial results may be impaired by improper conduct by any of our employees, agents, or business partners.
We cannot provide assurance that our internal controls and compliance systems will always protect us from acts committed by employees, agents, or business partners of ours (or of businesses we acquire or partner with) that would violate U.S. and/or non-U.S. laws, including the laws governing payments to government officials, bribery, fraud, kickbacks, and false claims, sales and marketing practices, conflicts of interest, competition, export and import compliance, and data privacy. In particular, the U.S. Foreign Corrupt Practices Act, the U.K. Bribery Act, and similar anti-bribery laws in other jurisdictions generally prohibit companies and their intermediaries from making improper payments to government officials for the purpose of obtaining or retaining business, and we operate in many parts of the world that have experienced governmental corruption to some degree. Any such improper actions or allegations of such acts could damage our reputation and subject us to civil or criminal investigations in the United States and in other jurisdictions and related shareholder lawsuits, could lead to substantial civil and criminal, monetary and non-monetary penalties and could cause us to incur significant legal and investigatory fees. In addition, though we rely on the third parties with whom we do business to adhere to the law and to our high standards of conduct, material violations of such standards of conduct could occur that could have a material effect on our financial results.
Our operations, products, and services expose us to the risk of environmental, health, and safety liabilities, costs, and violations that could adversely affect our reputation and financial results.
Our operations, products and services are subject to environmental laws and regulations, which impose limitations on the discharge of pollutants into the environment and establish standards for the use, generation, treatment, storage, and disposal of hazardous and non-hazardous wastes. We must also comply with various health and safety regulations in the United States and abroad in connection with our operations. In addition, some of our operations require the controlled use of hazardous or energetic materials in the development, manufacturing, or servicing of our products. We cannot assure you that our environmental, health, and safety compliance program has been or will at all times be effective. Failure to comply with any of these laws could result in civil and criminal, monetary and non-monetary penalties and damage to our reputation. In addition, we cannot provide assurance that our costs of complying with current or future environmental protection and health and safety laws will not exceed our estimates or adversely affect our financial results. Moreover, any accident that results in significant personal injury or property damage, whether occurring during development, manufacturing, servicing, use, or storage of our products, may result in significant production interruption, delays, or claims for substantial damages caused by personal injuries or property damage, harm to our reputation, and reduction in morale among our employees, any of which may adversely and materially affect our results of operations.
In addition, we may incur costs related to remedial efforts or alleged environmental damage associated with past or current waste disposal practices or other hazardous materials handling practices. We are also from time to time party to personal injury or other claims brought by private parties alleging injury due to the presence of or exposure to hazardous substances. We may also become subject to additional remedial, compliance or personal injury costs due to future events such as changes in existing laws or regulations, changes in agency direction or enforcement policies, developments in remediation technologies, changes in the conduct of our operations and changes in accounting rules. For additional information regarding these risks, please refer to Note 12 to the consolidated financial results. We cannot assure you that our liabilities arising from past or future releases of, or exposures to, hazardous substances will not exceed our estimates or adversely affect our reputation and financial results or that
20
we will not be subject to additional claims for personal injury or remediation in the future based on our past, present or future business activities.
Our businesses are subject to extensive regulation, including healthcare regulations; failure to comply with those regulations could adversely affect our financial results and our business, including our reputation.
In addition to the environmental, health, safety, anticorruption, data privacy, and other regulations noted elsewhere in this Annual Report, our businesses are subject to extensive regulation by U.S. and non-U.S. governmental and self-regulatory entities at the supranational, federal, state, local, and other jurisdictional levels, including the following:
•we are required to comply with various import laws and export control and economic sanctions laws, which may affect our transactions with certain customers, business partners, and other persons and dealings between our employees and between our subsidiaries. In certain circumstances, export control and economic sanctions regulations may prohibit the export of certain products, services, and technologies. In other circumstances, we may be required to obtain an export license before exporting the controlled item. Compliance with the various import laws that apply to our businesses can restrict our access to, and increase the cost of obtaining, certain products and at times can interrupt our supply of imported inventory. We may also face audits or investigations by one or more domestic or foreign government agencies relating to our compliance with these regulations. An adverse outcome in any such audit or investigation could subject us to fines or other penalties;
•we also have agreements to sell products and services to government entities and are subject to various statutes, regulations and other requirements that apply to companies doing business with government entities (approximately $417 million of our 2025 sales were made to the U.S. federal government). The laws governing government contracts differ from the laws governing private contracts. For example, many government contracts contain pricing and other terms and conditions that are not applicable to private contracts. Our agreements with government entities may be subject to termination, reduction, or modification at the convenience of the government or in the event of changes in government requirements, reductions in federal spending and other factors, and we may underestimate our costs of performing under the contract. In certain cases, a governmental entity may require us to pay back amounts it has paid to us. Government contracts that have been awarded to us following a bid process could become the subject of a bid protest by a losing bidder, which could result in loss of the contract. We are also subject to investigation and audit for compliance with the requirements governing government contracts. An adverse outcome in any such investigation or audit could subject us to fines or other penalties;
•we are also required to comply with increasingly complex and changing data privacy regulations in multiple jurisdictions that regulate the collection, use, protection, and transfer of personal data, including the transfer of personal data between or among countries. In particular, the General Data Protection Regulation became effective in the European Union in May 2018 and the California Consumer Privacy Act became effective in January 2020. We may also face audits or investigations by one or more domestic or foreign government agencies relating to our compliance with these regulations. An adverse outcome in any such audit or investigation could subject us to fines or other penalties. That or other circumstances related to our collection, use, and transfer of personal data could cause a loss of reputation in the market and/or adversely affect our business and financial position;
•certain of our products are medical devices that are subject to regulation by the U.S. FDA, by other federal and state governmental agencies, by comparable agencies of other countries and regions, and by certain accrediting bodies. To varying degrees, these regulators require us to comply with laws and regulations governing the development, testing, manufacturing, labeling, marketing, distribution, and post-marketing surveillance of our products. Government authorities may conclude that our business practices do not comply with current or future statutes, regulations, agency guidance or case law. Failure to obtain required regulatory clearances or approvals before marketing our products (or before implementing modifications to or promoting additional indications or uses of our products), other violations of laws or regulations, failure to remediate inspectional observations to the satisfaction of these regulatory authorities, and real or perceived efficacy or safety concerns or trends of adverse events with respect to our products (even after obtaining clearance for distribution) can lead to warning letters, notices to customers, declining sales, loss of customers, loss of market share, remediation and increased compliance costs, recalls, seizures, fines, expenses, injunctions, civil penalties, criminal penalties, consent decrees, administrative detentions, refusals to permit importations, partial or total shutdown of production facilities or the implementation of operating restrictions, narrowing of permitted uses for a product, refusal of the government to grant clearance, and suspension or withdrawal of approvals. Further, defending against any such actions can be costly and time-consuming and may require significant personnel resources. Therefore, even if we are successful in defending against any such actions brought against us, our business may be impaired;
•we are also subject to the federal False Claims Act (the “FCA”), which imposes civil and criminal liability on individuals or entities that knowingly submit false or fraudulent claims for payment to the government or knowingly make, or cause to be made, a false statement in order to have a false claim paid, including qui tam or whistleblower
21
suits. There are many potential bases for liability under the FCA. In addition, we could be held liable under the FCA if we are deemed to “cause” the submission of false or fraudulent claims;
•regulators in Europe and certain states in the U.S. have focused efforts on increasing disclosures by companies related to climate change and mitigation efforts that impose increasing compliance burdens and associated regulator costs. At the same time, conflicting and opposing views on environmental topics, including commitments addressing climate issues, are becoming increasing political, subject to scrutiny from private sectors and government authorities, with such conflicting and opposing views potentially exposing us to environmental or political activist campaigns; and
•we are also required to comply with ever changing labor and employment laws and regulations in multiple jurisdictions. These changes could negatively impact our business or financial position.
These are not the only regulations that our businesses must comply with. Generally, regulations we are subject to have tended to become more stringent over time and may be inconsistent across jurisdictions. We, our representatives, and the industries in which we operate may at times be under review and/or investigation by regulatory authorities. Failure to comply (or any alleged or perceived failure to comply) with the regulations referenced above or any other regulations could result in civil and criminal, monetary and non-monetary penalties, and any such failure or alleged failure (or becoming subject to a regulatory enforcement investigation) could also damage our reputation, disrupt our business, limit our ability to manufacture, import, export, and sell products and services, result in loss of customers and disbarment from selling to certain federal agencies and cause us to incur significant legal and investigatory fees. Compliance with these and other regulations may also affect our returns on investment, require us to incur significant expenses, or modify our business model or impair our flexibility in modifying product, marketing, pricing, or other strategies for growing our business. Our products and operations are also often subject to the rules of industrial standards bodies such as the International Standards Organization, and failure to comply with these rules could result in withdrawal of certifications needed to sell our products and services and otherwise adversely impact our financial results.
For additional information regarding these risks, please refer to the section entitled “Business—Regulatory Matters.”
Risk Related to Our Tax and Accounting Matters
Changes in our effective tax rates or exposure to additional tax liabilities or assessments could affect our profitability. In addition, audits by tax authorities could result in additional tax payments for prior periods.
We are subject to income, transaction and other taxes in the United States and in multiple foreign jurisdictions. Our future income tax rates could be volatile and difficult to predict due to changes in business profit by jurisdiction, changes in the amount and recognition of deferred tax assets and liabilities, or by changes in tax laws, regulations, or accounting principles. For example, the Organisation for Economic Co-operation and Development continues to advance proposals for modernizing international tax rules, including the introduction of global minimum tax standards. We closely monitor changes to tax laws, regulations, accounting principles, and global tax standards; and at the time of a change, the related expense or benefit recorded may be material to the quarter and year of change. Furthermore, certain tax laws are inherently ambiguous requiring subjective interpretation on the application thereof. Our interpretation and the corresponding amount of taxes we pay is, and may in the future continue to be, subject to audits by U.S. federal, state, and local tax authorities and by non-U.S. tax authorities. If these audits result in payments or assessments different from our reserves, our future results may include unfavorable adjustments to our tax liabilities and our financial results could be adversely affected.
We could incur significant liability if our separation from Danaher, our separation of Vontier or our separation of Ralliant (together, the “Separation Transactions”) are determined to be a taxable transaction.
We have received opinions from outside tax counsel to the effect that each of the Separation Transactions qualifies as a transaction that is described in Sections 355(a) and 368(a)(1)(D) of the Internal Revenue Code. The opinions rely on certain facts, assumptions, representations, and undertakings from the applicable parties regarding the past and future conduct of the companies’ respective businesses and other matters. If any of these facts, assumptions, representations, or undertakings are incorrect or not satisfied, our stockholders and we may not be able to rely on the applicable opinions of tax counsel and could be subject to significant tax liabilities. Notwithstanding the opinions of tax counsel we have received, the IRS could determine on audit that any of the Separation Transactions is taxable if it determines that any of the corresponding facts, assumptions, representations, or undertakings are not correct or have been violated or if it disagrees with the conclusions in any of the applicable opinions. If any of the Separation Transactions is determined to be taxable for U.S. federal income tax purposes, we, as well as our stockholders that are subject to U.S. federal income tax, would incur significant U.S. federal income tax liabilities.
Changes in U.S. GAAP could adversely affect our reported financial results and may require significant changes to our internal accounting systems and processes.
22
We prepare our consolidated financial results in conformity with generally accepted accounting principles in the United States of America (“GAAP”). These principles are subject to interpretation by the Financial Accounting Standards Board (“FASB”), the SEC, and various bodies formed to interpret and create appropriate accounting principles and guidance. Any new or amended standards may result in different accounting principles, which may significantly impact our reported results or could result in volatility of our financial results.
We may be required to recognize impairment charges for our goodwill and other intangible assets.
As of December 31, 2025, the net carrying value of our goodwill and other intangible assets totaled approximately $9.5 billion. In accordance with GAAP, we periodically assess these assets to determine if they are impaired. Significant negative industry or economic trends, disruptions to our business, inability to effectively integrate acquired businesses, unexpected significant changes or planned changes in use of our assets, changes in the structure of our business, divestitures, market capitalization declines, or increases in associated discount rates may impair our goodwill and other intangible assets. Any charges relating to such impairments would adversely affect our results of operations in the periods recognized. Refer to Note 2 and Note 4 to the consolidated financial results for a description of our policies relating to goodwill and acquired intangibles.
Risk Related to Our Financing Activities
We have incurred a significant amount of debt, and our debt obligations, including the cost of such debt, will increase further if we incur additional debt and do not retire existing debt, our credit rating declines, or if the applicable interest rates rise.
As of December 31, 2025, we had approximately $3.2 billion of long-term debt, including the current portion of long-term debt, on a consolidated basis. We may also obtain additional long-term debt and lines of credit to meet future financing needs. Our debt level and related debt service obligations could have negative consequences, including:
•requiring us to dedicate significant cash flow from operations to the payment of principal and interest on our debt, which would reduce the funds we have available for other purposes, such as acquisitions;
•making it more difficult for us to satisfy our obligations with respect to our debt;
•placing us at a competitive disadvantage compared to our competitors that are not as highly leveraged;
•limiting our ability to borrow additional funds;
•reducing our flexibility in planning for or reacting to changes in our business and market conditions;
•exposing us to interest rate risk since a portion of our debt obligations are at variable rates; and
•resulting in an event of default if we fail to satisfy our obligations under our debt or fail to comply with the financial or restrictive covenants contained in our debt instruments, which event of default could result in all of our debt becoming immediately due and payable and could permit certain of our lenders to foreclose on our assets securing such debt.
Our ability to satisfy our obligations depends on our future operating performance and on economic, financial, competitive, and other factors beyond our control. Our business may not generate sufficient cash flow to meet these obligations. If we are unable to service our debt or obtain additional financing, we may be forced to delay strategic acquisitions, capital expenditures, or research and development expenditures. We may not be able to obtain additional financing on terms acceptable to us or at all.
Additionally, the agreements governing our debt require that we maintain certain financial ratios, and contain affirmative and negative covenants that restrict our activities by, among other limitations, limiting our ability to incur additional indebtedness, make investments, create liens, sell assets, and enter into transactions with affiliates. The covenants in our credit agreement include a debt-to-EBITDA ratio. Please refer to Note 8 to the consolidated financial results for additional details.
Our ability to comply with these restrictions and covenants may be affected by events beyond our control. Our failure to comply with any of these restrictions or covenants may result in an event of default under the applicable debt instrument, which could permit acceleration of the debt under that instrument and require us to prepay that debt before its scheduled due date. Also, an acceleration of the debt under one of our debt instruments would trigger an event of default under other of our debt instruments.
ITEM 1B. UNRESOLVED STAFF COMMENTS
Not applicable.
ITEM 1C. CYBERSECURITY
Cybersecurity Risk Management and Strategy
23
As part of our cybersecurity controls and processes:
•we have designed our cybersecurity program based on the National Institute of Security and Technology (“NIST”) framework, Generally Accepted Privacy Program (“GAPP”) guiding principles, and ISO 27001/2 standards;
•our cybersecurity team, led by our Chief Information Officer (“CIO”) and Chief Information Security Officer (“CISO”) coordinates with our privacy and information governance team within our legal department to help ensure compliance with applicable regulatory and reporting requirements;
•the CIO and CISO undertake an annual review of the cybersecurity strategy and initiatives for Fortive and each of the operating companies, with monthly reviews of performance relative to strategic initiatives with the Chief Executive Officer (“CEO”) and the other executive officers;
•the CIO and CISO participate in product design efforts with operating company leaders to enhance our product security;
•through the compliance training program, we conduct mandatory cybersecurity management, data privacy and incident training for all employees;
•we conduct regular phishing email simulations for all employees and all contractors with access to corporate email systems to enhance awareness and responsiveness to possible threats;
•through policy, practice and contract provisions, we require employees, as well as third-party vendors who process data, to treat customer and other personal information and data with care and in compliance with regulations;
•we run tabletop exercises conducted by leading third-party cybersecurity experts, with involvement by the broader IT team, legal team, communications team, executive management team, and the Board, to simulate a response to a cybersecurity incident and use the findings to improve our processes and technologies;
•we conduct regular network and endpoint monitoring, vulnerability assessments, and penetration testing designed to improve our information systems;
•we review and update, and provide training, on cybersecurity incident response plans, business continuity plans, and cyber incident escalation plans, including the involvement of our Disclosure Committee (which includes our CISO as a regular member);
•as part of that cyber incident escalation plan, our Disclosure Committee reviews cybersecurity incidents to assess materiality and consider disclosure requirements;
•the CISO meets with the information security teams at the operating companies on a monthly basis, or as needed, to review escalated items, compliance with incident response plans, and performance against strategic targets;
•the CIO and the CISO meet with the CEOs of our operating segments and the presidents of our operating companies to discuss IT strategies, updates, and initiatives, including those related to cybersecurity;
•the CIO and the CISO meet with the Audit Committee on a quarterly basis and the full Board on an annual basis to provide updates on the cybersecurity program, including controls and processes, strategies, achievements, risks, and recent incidents;
24
•the CIO and the CISO also meet with the full Board on an annual basis as part of the overall enterprise risk management review; and
•the CISO, as a member of the Disclosure Committee, meets with other members of the Disclosure Committee to discuss materiality and disclosure with respect to cybersecurity matters.
As part of the above processes, we regularly engage with assessors, consultants, auditors, and other third parties, including by regularly having independent cybersecurity experts conduct tabletop exercises, conduct penetration tests, and review our cybersecurity program to help identify areas for continued focus, improvement and compliance.
Cybersecurity Governance
Cybersecurity is an important part of our risk management processes and an area of focus for our Board and management.
Our Audit Committee is responsible for the oversight of risks from cybersecurity threats and provides regular reports to the entire Board. In addition, at least annually, the entire Board receives an overview from management of our cybersecurity threat risk management and strategy processes covering topics such as data security posture, results from third-party assessments, progress towards predetermined risk-mitigation-related goals, our incident response plan, and material cybersecurity threat risks or incidents and developments, as well as the steps management has taken to respond to such risks. In such sessions, the Board generally receives materials indicating current and emerging material cybersecurity threat risks and describing the company’s ability to mitigate those risks, and discusses such matters with our CIO and CISO. Material cybersecurity threat risks are also considered during separate Board meeting discussions of overall key enterprise risks, operational budgeting, crisis management planning, and other relevant matters.
Our cybersecurity risk management and strategy processes, which are discussed in greater detail above, are led by our CIO and our CISO. Our CIO and our CISO have over 30 years and 25 years, respectively, of prior work experience in various roles involving managing information security, developing cybersecurity strategy, implementing effective information and cybersecurity programs and implementing business continuity planning and incident response plans. Our CIO and CISO each hold several degrees and certifications relevant to their roles. Our CIO and our CISO are informed about and monitor the prevention, mitigation, detection, and remediation of cybersecurity incidents through their management of, and participation in, the cybersecurity risk management and strategy processes described above, including the operation of our incident response plan, oversight of the entire IT function, including at Fortive Corporation and the IT leaders at our operating companies.
ITEM 2. PROPERTIES
Our corporate headquarters is located in Everett, Washington in a facility that we own. As of December 31, 2025, our facilities included approximately 40 significant facilities, which are used for manufacturing, distribution, warehousing, research and development, general administrative, and/or sales functions. Approximately 20 of these facilities are located in the United States in over 10 states and approximately 20 are located outside the United States in over 10 countries, including Canada and
25
countries in Asia Pacific, Europe, and Latin America. Particularly outside the United States, facilities may serve more than one business segment and may be used for multiple purposes, such as administration, sales, manufacturing, warehousing, and/or distribution. The approximate number of significant facilities by business segment is: Intelligent Operating Solutions 25 and Advanced Healthcare Solutions 15.
We consider our facilities suitable and adequate for the purposes for which they are used and do not anticipate difficulty in renewing existing leases as they expire or in finding alternative facilities. We believe our properties and equipment have been well-maintained. Please refer to Note 7 to the consolidated financial statements for additional information with respect to our lease commitments.
ITEM 3. LEGAL PROCEEDINGS
We are, from time to time, subject to a variety of litigation and other legal and regulatory proceedings and claims incidental to our business. Based upon our experience, current information, and applicable law, we do not believe that these proceedings and claims will have a material effect on our financial position, results of operations or cash flows. Please refer to Note 12 to the consolidated financial statements for information regarding legal proceedings and contingencies, and for a discussion of risks related to legal proceedings and contingencies, refer to "Item 1A. Risk Factors."
ITEM 4. MINE SAFETY DISCLOSURES
Not applicable.
INFORMATION ABOUT OUR EXECUTIVE OFFICERS
Set forth below are the names, ages, positions, and experience of our executive officers as of February 25, 2026. All of our executive officers hold office at the pleasure of our Board.
| Name | Age | Position | Officer Since | |||||||||||||||||
| Olumide Soroye | 53 | President and Chief Executive Officer | 2021 | |||||||||||||||||
| Mark Okerstrom | 53 | Senior Vice President – Chief Financial Officer | 2025 | |||||||||||||||||
| Amee Desjourdy | 53 | Senior Vice President – Chief People Officer | 2026 | |||||||||||||||||
| Peter C. Underwood | 56 | Senior Vice President – Chief Legal Officer | 2016 | |||||||||||||||||
Olumide Soroye has served as President and CEO and a Director of Fortive since June 2025. Prior to June 2025, Mr. Soroye served as President and CEO of Intelligent Operating Solutions from August 2021 and President and CEO of Advanced Healthcare Solutions from January 2025. Prior to joining Fortive, Mr. Soroye was the Managing Director of the Property Intelligence and Risk Management segment of CoreLogic from September 2013 to August 2021.
Mark Okerstrom has served as Senior Vice President, Chief Financial Officer of Fortive since March 2025. Prior to joining Fortive, Mr. Okerstrom served as an advisor at Bain & Company from April 2024 to March 2025 and as an advisor at Advent International from November 2024 to March 2025. In addition, Mr. Okerstrom served as President and Chief Operating Officer of Convoy, Inc. from August 2020 to October 2023. Prior to joining Convoy, Inc., Mr. Okerstrom served in various roles, including as Chief Executive Officer, President, Chief Financial Officer, Executive Vice President of Operations, and Senior Vice President of Corporate Development, at Expedia Group, Inc. from 2006 to 2019.
Amee Desjourdy has served as Senior Vice President – Chief People Officer of Fortive since January 2026. Prior to joining Fortive, Ms. Desjourdy served in Chief Human Resource Officer roles at Hitachi Ltd from July 2022 to January 2026. Prior to joining Hitachi Ltd, Ms. Desjourdy was Chief People Officer of Brightcove, a software company providing secure and scalable streaming platform to organizations, from February 2020 to July 2022. Prior to joining Brightcove, Ms. Desjourdy served as the Chief People and Culture Officer of Quanterix, a biotehcnology company, from 2019 to 2020 and as the Chief Human Resources Officers of Global Partners LP, an energy company, from 2014 to 2019.
Peter C. Underwood has served as Senior Vice President, Chief Legal Officer of Fortive since January 2025 and as Senior Vice President, General Counsel from May 2016 to January 2025. Prior to joining Fortive, Mr. Underwood served as Vice President, General Counsel and Secretary of Regal Beloit Corporation, a manufacturer of electric motors, from 2010 through May 2016.
26
PART II
ITEM 5. MARKET FOR THE REGISTRANT’S COMMON EQUITY, RELATED STOCKHOLDER MATTERS AND ISSUER PURCHASES OF EQUITY SECURITIES
Our common stock has been traded on the New York Stock Exchange under the symbol FTV since July 2, 2016. As of February 20, 2026, there were approximately 1,523 holders of record of our common stock.
We currently pay a quarterly dividend of $0.06 per share on our common stock. Any future declaration and payments of dividends, including any change in the amount of quarterly dividend, on our common stock will be determined by our Board of Directors and will depend on our business conditions, financial results and other factors our Board deems relevant.
Issuer Purchases of Equity Securities
On February 17, 2022, our Board approved a share repurchase program authorizing us to repurchase up to 20 million shares of our outstanding common stock (the “General Share Repurchase Program”). Under this program, shares may be repurchased from time to time on the open market or in privately negotiated transactions, including under accelerated share repurchase programs or under plans complying with Rule 10b5-1 under the Securities Exchange Act of 1934, as amended (“10b5-1 Plans”). On May 27, 2025, in connection with the Separation, our Board adopted a separate and incremental special purpose share repurchase program (the “Special Purpose Share Repurchase Program”) under which we may purchase up to $550 million in our common stock exclusively from the proceeds we received as a dividend from Ralliant in connection with the Separation (the “Ralliant Dividend”) (as defined herein), together with any other cash received from Ralliant in connection with the Separation (collectively, the “Ralliant Cash Proceeds”). Repurchases of shares of our common stock using the Ralliant Cash Proceeds will only be made through the Special Purpose Share Repurchase Program.
On May 27, 2025 and November 5, 2025, our Board increased the number of shares authorized under the General Share Repurchase Program by an additional 15.6 million and 12.1 million shares, respectively. As of December 31, 2025, there were 15.5 million shares remaining authorized under the General Share Repurchase Program and $67.5 million remaining authorized under the Special Share Repurchase Program, respectively. There is no expiration date for the repurchase programs, and the timing and amount of repurchases under the programs are determined by our management based on market conditions, tax regulations and other factors. The repurchase programs may be suspended or discontinued at any time by the Board.
During the fiscal year ended December 31, 2025, the Company purchased 30.4 million shares of its common stock at an average share price of $52.79.
The following table provides details about our share repurchases during the fiscal quarter ended December 31, 2025.
| Period | Total number of shares (or units) purchased | Average price paid per share (or unit) | Total number of shares (or units) purchased as part of publicly announced plans or programs (a) | Maximum number of shares (or units) that may yet be purchased under the General Share Repurchase Program | Maximum approximate dollar value that may yet be purchased under the Special Share Repurchase Program | ||||||||||||||||||||||||
September 27 - October 26 | — | $ | — | — | 8,258,190 | $ | 78,204,249 | ||||||||||||||||||||||
October 27 - November 26 | 3,794,362 | 51.03 | 3,794,362 | 16,628,911 | 78,204,249 | ||||||||||||||||||||||||
November 27 - December 31 | 1,319,684 | 54.03 | 1,319,684 | 15,503,263 | 67,483,059 | ||||||||||||||||||||||||
| Total | 5,114,046 | $ | 51.80 | 5,114,046 | 15,503,263 | 67,483,059 | |||||||||||||||||||||||
(a) The total amount includes 194,036 shares purchased under the Special Repurchase Program. | |||||||||||||||||||||||||||||
Recent Issuances of Unregistered Securities
None.
Company Stock Performance
This performance graph shall not be deemed “filed” for purposes of Section 18 of the Securities Exchange Act of 1934, as amended (the “Exchange Act”), or incorporated by reference into any filing of the Company under the Securities Act of 1933, as amended (the “Securities Act”), or the Exchange Act, except as shall be expressly set forth by specific reference in such filing.
27
The following graph shows a comparison of five-year cumulative total shareholder return, calculated on a dividend-reinvested basis, for the Company, the S&P 500 Index, and the S&P 500 Industrials Index. The graph assumes $100 was invested in each of the Company’s common stock, the S&P 500 Index, and the S&P 500 Industrial Index as of the market close on December 31, 2020. Past stock performance is not necessarily indicative of future stock price performance.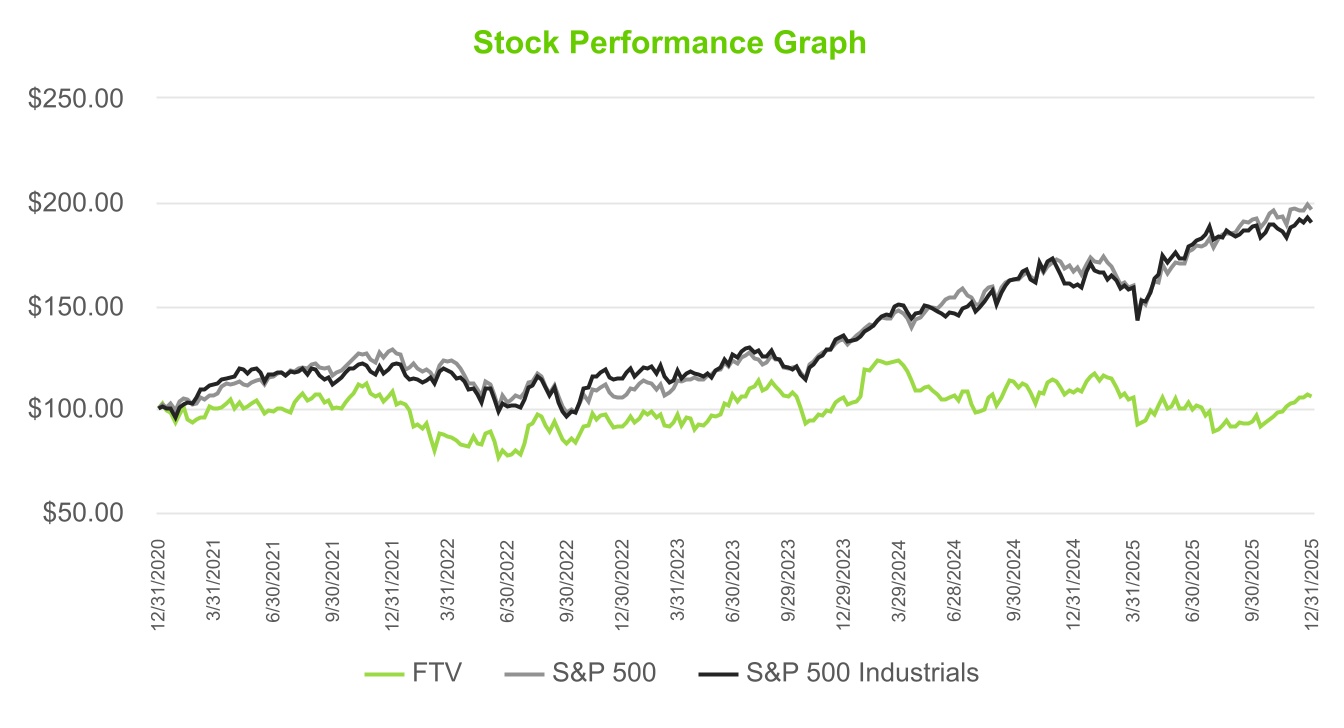
| 12/31/2021 | 12/30/2022 | 12/29/2023 | 12/27/2024 | 12/31/2025 | |||||||||||||
| Fortive Corporation | 108.14 | 91.47 | 105.27 | 107.67 | 105.68 | ||||||||||||
| S&P 500 | 128.71 | 105.40 | 133.10 | 166.40 | 196.16 | ||||||||||||
| S&P 500 Industrials | 121.12 | 114.48 | 135.24 | 158.87 | 189.72 | ||||||||||||
*Assumes $100 was invested for each annual period. | |||||||||||||||||
ITEM 6. [RESERVED]
Not applicable.
ITEM 7. MANAGEMENT’S DISCUSSION AND ANALYSIS OF FINANCIAL CONDITION AND RESULTS OF OPERATIONS
The following discussion and analysis of Fortive’s financial condition and results of operations for the fiscal years ended December 31, 2025, December 31, 2024, and December 31, 2023 should be read in conjunction with our audited consolidated financial statements and accompanying notes included in Part II, Item 8 of this Form 10-K. This Item generally discusses 2025, 2024, and 2023 items and year-to-year comparisons between 2025 and 2024, and 2024 and 2023.
Fortive Corporation (“Fortive,” “the Company,” “we,” “us,” or “our”) innovates essential technologies to keep our world safe and productive. Our strategic segments - Intelligent Operating Solutions and Advanced Healthcare Solutions - include iconic inventor brands with leading positions in their markets. Our businesses design, develop, manufacture, and market products, software, and services, building upon leading brand names, innovative technologies, and strong market positions. Our research and development, manufacturing, sales, distribution, service, and administrative facilities are located in approximately 50 countries around the world.
28
Precision Technologies Separation
On June 28, 2025 (the “Distribution Date”), the Company completed the separation (the “Separation” or the “PT Separation”) of its former Precision Technologies segment by distributing to Fortive shareholders on a pro rata basis all of the issued and outstanding common stock of Ralliant Corporation (“Ralliant”), the entity incorporated to hold the PT businesses. The accounting requirements for reporting Ralliant as a discontinued operation were met when the Separation was completed. Accordingly, the accompanying consolidated financial statements for all periods presented reflect this business as a discontinued operation. Unless otherwise indicated, all references in this Annual Report refer to continuing operations. Refer to Note 3 of the consolidated financial statements for additional information.
This MD&A is designed to provide a reader of our financial statements with a narrative from the perspective of management. Our MD&A is divided into seven sections:
•Basis of Presentation
•Overview
•Results of Operations
•Financial Instruments and Risk Management
•Liquidity and Capital Resources
•Critical Accounting Estimates
•New Accounting Standards
OVERVIEW
General
Fortive is a multinational business with global operations with approximately 44% of our sales derived from customers outside the United States in 2025. As a company with global operations, our businesses are affected by worldwide, regional, and industry-specific economic, trade policies, fiscal policies, regulatory, and political factors. Our geographic and industry diversity, as well as the range of products, software, and services we offer, typically help limit the impact of any one industry or the economy of any single country, except for the United States, on our operating results. Given the broad range of products manufactured, software and services provided, and geographies served, we do not use any indices other than general economic trends to predict the overall outlook for the Company. Our individual businesses monitor key competitors and customers, including their sales, to the extent possible, to gauge relative performance and the outlook for the future.
As a result of our geographic and industry diversity, we face a variety of opportunities and challenges, including technological development in most of the markets we serve, the expansion and evolution of opportunities in growing markets, trends and costs associated with a global labor force, trade policies, and consolidation of our competitors. We operate in a highly competitive business environment in most markets, and our long-term growth and profitability will depend, in particular, on our ability to expand our business across geographies and market segments, identify, consummate, and integrate appropriate acquisitions, develop innovative and differentiated new products, services, and software, expand and improve the effectiveness of our sales force, continue to reduce costs and improve operating efficiency and quality, attract relevant talent and retain, grow, and empower our talented workforce, and effectively address the demands of an increasingly regulated environment. We are making significant investments, organically and through acquisitions, to address technological change in the markets we serve and to improve our manufacturing, research and development, and customer-facing resources in order to be responsive to our customers throughout the world.
Non-GAAP Measures
In this report, references to sales from existing businesses (“core revenue”) refer to sales from operations calculated according to generally accepted accounting principles in the United States (“GAAP”) but excluding (1) the impact from acquired and divested businesses and (2) the impact of foreign currency translation. References to sales attributable to acquisitions or acquired businesses refer to GAAP sales from acquired businesses recorded prior to the first anniversary of the acquisition, less the amount of sales attributable to certain businesses or product lines that have been divested, or, at the time of reporting, are pending divestiture, but are not, and will not be, considered discontinued operations prior to the first anniversary of the divestiture. The portion of sales attributable to the impact of currency translation is calculated as the difference between (a) the period-to-period change in sales (excluding sales impact from acquired businesses) and (b) the period-to-period change in sales
29
(excluding sales impact from acquired businesses) after applying the current period foreign exchange rates to the prior year period. Core revenue should be considered in addition to, and not as a replacement for or superior to, sales, and may not be comparable to similarly titled measures reported by other companies.
Management believes that reporting the non-GAAP financial measure of core revenue provides useful information to investors by helping identify underlying growth trends in our business and facilitating comparisons of our sales performance with our performance in prior and future periods and to our peers. We exclude the effect of acquisition and divestiture related items because the nature, size, and number of such transactions can vary dramatically from period to period and between us and our peers. We exclude the effect of currency translation from core revenue because the impact of currency translation is not under management’s control and is subject to volatility. Management believes the exclusion of the effect of acquisitions and divestitures and currency translation may facilitate the assessment of underlying business trends and may assist in comparisons of long-term performance. References to core sales growth refer to the impact of both price and unit sales.
Business Trends
Our financial outlook is subject to various assumptions and risks, including but not limited to: ongoing geopolitical events; global economic and consumer trends and sentiments; monetary policies; inflationary pressures on expenses and pricing; uncertainties in governmental policies on international trade, regulations, sanctions, and healthcare; operational challenges from existing, new, or increased tariffs, in some cases, subsequent rollbacks or suspensions; foreign exchange rate volatility, including the impact of unhedged foreign currency debts; reduction in U.S. government spending due to H.R.1, also known as the One Big Beautiful Bill Act (“OBBBA”); and overall fiscal policies, including investment and taxation policy initiatives being considered in the U.S.; the incremental impacts of the Pillar Two initiative from the Organization for Economic Co-operation and Development (“OECD”); and the impact from the Separation.
In addition, our financial outlook is subject to the impact of the recent ruling by the Supreme Court of the United States invalidating certain tariffs previously imposed under the International Emergency Economic Powers Act ("the IEEPA Ruling"), including the impact on operational and transaction costs, any responsive legislative or executive action seeking to reimpose similar tariffs, our ability to seek and obtain refunds for previously paid tariffs that have been subsequently invalidated, expectations or actions of customers, suppliers and other distribution or supply chain partners on pricing or costs as a result of the IEEPA Ruling, and responsive actions from other countries, including with respect to counter tariffs that had been imposed or trade agreements that had been adopted in response to tariffs that have been subsequently invalidated by the IEEPA Ruling.
We continue to monitor the conditions above and deploy the Fortive Business System (“FBS”), including tools and processes to leverage existing sourcing strategies and optimize production and logistics to actively manage these challenges and utilize pricing, cost and productivity actions and other countermeasures designed to offset the aforementioned dynamics.
RESULTS OF OPERATIONS
Components of Sales Growth
2025 vs. 2024 | 2024 vs. 2023 | ||||||||||
| Total revenue growth (GAAP) | 1.9 | % | 4.3 | % | |||||||
Excluding impact of: | |||||||||||
Acquisitions and Divestitures | 0.2 | % | (0.6) | % | |||||||
Currency exchange rates | (0.4) | % | 0.6 | % | |||||||
Core revenue growth (Non-GAAP) | 1.7 | % | 4.3 | % | |||||||
Sales growth in 2025 was driven by favorable pricing of 2.2%, partially offset by a volume decline of 0.6%. Sales growth in 2024 was driven by favorable pricing of 2.9% and a volume increase of 1.4%.
Geographically, core revenue growth in 2025 was driven primarily by strengthening demand in North America, led by the IOS segment, partially offset by modest declines in Europe. Core revenue growth in 2024 was driven by modest to moderate growth across all regions, including North America, Europe, the Middle East, and Africa (“EMEA”), Latin America (“LATAM”), and Asia-Pacific (“APAC”).
For further detail, refer to the Intelligent Operating Solutions and Advanced Healthcare Solutions sections below.
30
Operating Profit Margins
2025 vs. 2024
Operating profit margin was 17.3% in 2025, compared to 17.6% in 2024, resulting in a decrease of 30 basis points due to:
•The year-over-year increase from favorable pricing across the segments and benefits from productivity measures and FBS initiatives, partially offset by volume decline and higher employee compensation in both segments; additionally, within the year, the unfavorable impact from tariffs was mitigated by countermeasures — favorable 105 basis points
•The year-over-year effect of all other items, including -100 basis points primarily from incremental stock-based compensation costs related to the Separation, -55 basis points in discrete restructuring charges, partially offset by +20 basis points from amortization expense for existing businesses — unfavorable 135 basis points
2024 vs. 2023
Operating profit margin was 17.6% 2024, compared to 14.7% in 2023, resulting in an increase of 290 basis points due to:
•The year-over-year increase in price and volume from existing businesses and benefits from productivity measures were partially offset by higher employee compensation, growth investments and the impact of unfavorable changes in foreign exchange rates — favorable 170 basis points
•The year-over-year effect of all other items, including +70 basis points in discrete restructuring charges, +55 basis points from amortization expense associated with existing businesses and impairment of intangible assets in 2023, offset by -5 basis points from net effects of acquired businesses — favorable 120 basis points
INTELLIGENT OPERATING SOLUTIONS
Selected Financial Data
| For the Year Ended December 31 | |||||||||||||||||
| ($ in millions) | 2025 | 2024 | 2023 | ||||||||||||||
| Sales | $ | 2,856.3 | $ | 2,793.2 | $ | 2,684.5 | |||||||||||
| Operating profit | 738.3 | 708.0 | 629.9 | ||||||||||||||
| Depreciation | 49.3 | 40.5 | 33.9 | ||||||||||||||
| Amortization | 187.1 | 188.3 | 185.5 | ||||||||||||||
| Operating profit as a % of sales | 25.8 | % | 25.3 | % | 23.5 | % | |||||||||||
| Depreciation as a % of sales | 1.7 | % | 1.4 | % | 1.3 | % | |||||||||||
| Amortization as a % of sales | 6.6 | % | 6.7 | % | 6.9 | % | |||||||||||
Components of Sales Growth
2025 vs. 2024 | 2024 vs. 2023 | ||||||||||
| Total revenue growth (GAAP) | 2.3 | % | 4.1 | % | |||||||
Excluding impact of: | |||||||||||
| Acquisitions and Divestitures | 0.4 | % | (0.8) | % | |||||||
| Currency exchange rates | (0.6) | % | 0.2 | % | |||||||
Core revenue growth (Non-GAAP) | 2.1 | % | 3.5 | % | |||||||
Sales growth in 2025 was driven by favorable pricing of 2.2%, including actions taken to mitigate unfavorable tariff impacts. Volume declined slightly, primarily in professional instrumentation during the first half of the year, partially offset by increases in gas detection products and facilities and asset lifecycle (“FAL”) software and services. Sales growth in 2024 was driven primarily by favorable pricing of 2.7% and volume gains with FAL software and services and gas detection products.
Geographically, core revenue growth in 2025 was driven primarily by moderate growth in North America, partially offset by modest declines in Europe. Core revenue growth in 2024 was driven by modest growth across all regions.
31
Operating Profit Margins
2025 vs. 2024
Operating profit margin increased 50 basis points during 2025 as compared to 2024 resulting from:
•The year-over-year increase in price and gains achieved from FBS and productivity initiatives which were partially offset by slight volume decline and higher employee compensation; additionally, within the year, the unfavorable impact from tariffs was mitigated by countermeasures — favorable 85 basis points
•The year-over-year effect of all other items, including -60 basis points in discrete restructuring charges, offset by +20 basis points from amortization expense for existing businesses, and +5 basis points from lower net acquisition and divestiture-related costs — unfavorable 35 basis points
2024 vs. 2023
Operating profit margin increased 180 basis points during 2024 as compared to 2023 resulting from:
•The year-over-year increase in price and volume from existing businesses, partially offset by higher employee compensation, customer acquisition costs and marketing costs to support growth initiatives — favorable 95 basis points
•The year-over-year effect of all other items, including +50 basis points from lower discrete restructuring charges than in the prior year, +50 basis points from amortization expense for existing businesses and impairment of intangible assets incurred in 2023, offset by -15 basis points from net effects of acquired businesses — favorable 85 basis points
ADVANCED HEALTHCARE SOLUTIONS
Advanced Healthcare Solutions Selected Financial Data
| For the Year Ended December 31 | |||||||||||||||||
| ($ in millions) | 2025 | 2024 | 2023 | ||||||||||||||
| Sales | $ | 1,302.8 | $ | 1,287.7 | $ | 1,229.4 | |||||||||||
| Operating profit | 138.6 | 138.5 | 83.8 | ||||||||||||||
| Depreciation | 19.5 | 20.2 | 21.2 | ||||||||||||||
| Amortization | 180.3 | 181.0 | 181.4 | ||||||||||||||
| Operating profit as a % of sales | 10.6 | % | 10.8 | % | 6.8 | % | |||||||||||
| Depreciation as a % of sales | 1.5 | % | 1.6 | % | 1.7 | % | |||||||||||
| Amortization as a % of sales | 13.8 | % | 14.1 | % | 14.8 | % | |||||||||||
Components of Sales Growth
2025 vs. 2024 | 2024 vs. 2023 | ||||||||||
| Total revenue growth (GAAP) | 1.2 | % | 4.7 | % | |||||||
Excluding impact of: | |||||||||||
| Currency exchange rates | (0.4) | % | 1.4 | % | |||||||
Core revenue growth (Non-GAAP) | 0.8 | % | 6.1 | % | |||||||
Sales growth in 2025 was driven by favorable pricing of 2.2%. Volume declined modestly on reduced demand for sterilization equipment and biomedical test products due to the impact of recent changes in healthcare policy, partially offset by growth in healthcare software and dosimetry services. Sales growth in 2024 was driven primarily by favorable pricing of 3.4% and volume increases primarily in sterilization and dosimetry products.
Geographically, core revenue growth in 2025 was relatively stable with modest increases in North America mostly offset by modest declines in EMEA. Core revenue growth in 2024 was driven by modest to moderate growth across all regions.
32
Operating Profit Margins
2025 vs. 2024
Operating profit margin decreased 20 basis points during 2025 as compared to 2024 resulting from:
•Year-over-year increases due to favorable pricing and gains achieved from FBS and from productivity initiatives, partially offset by modest volume decline and higher employee compensation — unfavorable 20 basis points
•The year-over-year effect of all other items, including +20 basis points from amortization expense for existing businesses, -20 basis points in discrete restructuring charges — relatively flat
2024 vs. 2023
Operating profit margin increased 400 basis points during 2024 as compared to 2023 resulting from:
•Year-over-year increases due to favorable pricing and higher volume, and benefits from productivity measures, partially offset by higher employee compensation and unfavorable changes in foreign currency exchange rates — favorable 215 basis points
•The year-over-year effect of all other items, including +115 basis points in discrete restructuring charges and +70 basis points from amortization expense for existing businesses — favorable 185 basis points
COST OF SALES AND GROSS PROFIT
| For the Year Ended December 31 | |||||||||||||||||
| ($ in millions) | 2025 | 2024 | 2023 | ||||||||||||||
| Sales | $ | 4,159.1 | $ | 4,080.9 | $ | 3,913.9 | |||||||||||
| Cost of sales | (1,518.0) | (1,461.8) | (1,436.8) | ||||||||||||||
| Gross profit | 2,641.1 | 2,619.1 | 2,477.1 | ||||||||||||||
| Gross profit margin | 63.5 | % | 64.2 | % | 63.3 | % | |||||||||||
Gross profit increased during 2025 as compared to 2024, primarily due to favorable pricing, gains from FBS and productivity measures all partially offset by volume declines, higher employee compensation, and discrete restructuring charges. Within the year, the unfavorable impact of tariffs were mitigated by the countermeasures deployed.
Gross profit increased during 2024 as compared to 2023, primarily due to favorable pricing and increased volume from existing businesses, benefits from productivity measures and FBS initiatives, partially offset by higher employee compensation, and unfavorable changes in foreign currency exchange rates.
OPERATING EXPENSES
| For the Year Ended December 31 | |||||||||||||||||
| ($ in millions) | 2025 | 2024 | 2023 | ||||||||||||||
| Sales | $ | 4,159.1 | $ | 4,080.9 | $ | 3,913.9 | |||||||||||
Selling, general, and administrative (“SG&A”) | 1,661.7 | 1,651.5 | 1,666.1 | ||||||||||||||
Research and development (“R&D”) | 259.2 | 251.3 | 237.0 | ||||||||||||||
| SG&A as a % of sales | 40.0 | % | 40.5 | % | 42.6 | % | |||||||||||
| R&D as a % of sales | 6.2 | % | 6.2 | % | 6.1 | % | |||||||||||
SG&A increased in 2025 as compared to 2024, primarily due to incremental stock-based compensation related to the Separation, higher employee compensation costs, discrete restructuring charges, and innovation and commercial investments to support strategic growth initiatives, all partially offset by reductions of excess costs subsequent to the Separation and benefits from productivity measures and FBS initiatives.
SG&A expenses decreased during 2024 as compared to 2023, primarily due to benefits from productivity measures and lower discrete restructuring costs, partially offset by higher employee compensation.
R&D, consisting principally of internal and contract engineering personnel costs, increased year over year during both 2025 and 2024 due to ongoing investments in innovation.
33
NON-OPERATING INCOME (EXPENSE), NET
Interest costs
Net interest expense was $120.5 million during 2025, compared to $152.8 million during 2024. The year-over-year decrease was primarily due to a decrease in outstanding debt and lower interest rates associated with floating rate debt instruments.
Net interest expense was $152.8 million during 2024, compared to $123.5 million during 2023. The year-over-year increase was primarily due to higher overall debt balances.
For a discussion of our outstanding indebtedness, refer to Note 8 to the accompanying consolidated financial statements.
Other non-operating expense, net
Other non-operating expense was $2.5 million, $57.2 million, and $17.4 million during 2025, 2024, and 2023, respectively. The year over year changes were primarily due to losses from equity investments incurred in 2024 and 2023, and a charitable contribution of $20.0 million made to the Fortive Foundation, a related party, without any donor imposed conditions or restrictions, in the first quarter of 2024.
INCOME TAXES
General
Income tax expense and deferred tax assets and liabilities reflect management’s assessment of future taxes expected to be paid on items reflected in our financial statements. We record the tax effect of discrete items and items that are reported net of their tax effects in the period in which they occur.
Our effective tax rate can be affected by, among others, changes in the mix of earnings in countries with differing statutory tax rates (including as a result of business acquisitions and dispositions), changes in the valuation of deferred tax assets and liabilities, accruals related to contingent tax liabilities and period-to-period changes in such accruals, the results of audits and examinations of previously filed tax returns (as discussed below), the expiration of statutes of limitations, the implementation of tax planning strategies, tax rulings, court decisions, settlements with tax authorities, and changes in tax laws.
We are subject to income, transaction and other taxes in the United States and in multiple foreign jurisdictions. Our future income tax rates could be volatile and difficult to predict due to changes in business profit by jurisdiction, changes in the amount and recognition of deferred tax assets and liabilities, or by changes in tax laws, regulations, or accounting principles. For example, the OECD continues to advance proposals for modernizing international tax rules, including the introduction of global minimum tax standards and the more recent Side-by-Side System. We closely monitor changes to tax laws, regulations, accounting principles, and global tax standards; and at the time of a change, the related expense or benefit recorded may be material to the quarter and year of change. Furthermore, certain tax laws are inherently ambiguous requiring subjective interpretation on the application thereof. Our interpretation and the corresponding amount of taxes we pay is, and may in the future continue to be, subject to audits by U.S. federal, state, and local tax authorities and by non-U.S. tax authorities. If these audits result in payments or assessments different from our reserves, our future results may include unfavorable adjustments to our tax liabilities and our financial statements could be adversely affected.
We are subject to examination in the United States, various states and foreign jurisdiction for the tax years 2011 to 2024. These examinations include filings of tax returns prior to our separation from Danaher, tax returns of enterprises no longer in our portfolio, and tax returns for pre-acquisition periods of enterprises added to our portfolio. In addition, significant obligations are detailed in our tax matters agreements in connection with the separation of Fortive from Danaher on July 1, 2016, the split-off of the Automation and Specialty business on October 1, 2018, the Vontier separation on October 9, 2020, and the PT Separation on June 28, 2025. We review our global tax positions on a quarterly basis, considering many factors including the results of discussions and resolutions of matters with certain tax authorities, tax rulings and court decisions, and the expiration of statutes of limitations reserves for contingent tax liabilities are accrued or adjusted as necessary.
For a discussion of risks related to these and other tax matters, please refer to “Item 1A. Risk Factors.”
Effective Tax Rate
Our effective tax rate was 11.5%, 4.7%, 5.7% during 2025, 2024, and 2023, respectively.
34
Our effective tax rate for 2025, 2024 and 2023 differs from the U.S. federal statutory rate of 21% due primarily to the positive and negative effects of foreign income taxed at a different rate, the U.S. federal permanent differences, the impacts of credits and deductions provided by law, including those associated with state income taxes, decreases in our uncertain tax positions and the effect of changes in tax rates enacted.
Repatriation
Foreign cumulative earnings remain subject to foreign remittance taxes. We have made an election regarding the amount of earnings that we do not intend to repatriate due to local working capital needs, local law restrictions, high foreign remittance costs, previous investments in physical assets and acquisitions, or future growth needs. For most of our foreign operations, we make an assertion regarding the amount of earnings in excess of intended repatriation that are expected to be held for indefinite reinvestment. No provisions for foreign remittance taxes have been made with respect to earnings that are planned to be reinvested indefinitely. Estimating the amount of potential tax is not practicable because of the complexity and variety of assumptions necessary to compute the tax.
COMPREHENSIVE INCOME
Comprehensive income increased by $60 million in 2025 as compared to 2024, primarily due to favorable changes in foreign currency translation of $314 million, and a $50 million increase in net earnings from continuing operations. Additionally, there was a $304 million decrease in net earnings from discontinued operations.
Comprehensive income decreased by $172 million in 2024 as compared to 2023, primarily due to an unfavorable change in foreign currency translation adjustments of $149 million, partially offset by a $74 million increase in net earnings from continuing operations and a favorable change in pension benefit adjustments of $11 million. Additionally, there was a $107 million decrease in net earnings from discontinued operations.
FINANCIAL INSTRUMENTS AND RISK MANAGEMENT
We are exposed to market risk from changes in interest rates, foreign currency exchange rates, credit risk and commodity prices, each of which could impact our financial statements. We generally address our exposure to these risks through our normal operating and financing activities. In addition, our broad-based business activities help to reduce the impact that volatility in any particular area or related areas may have on our operating profit as a whole.
Interest Rate Risk
We utilize a mixture of fixed-rate and variable-rate debt. A change in interest rates impacts the fair value of our fixed-rate debt but not our earnings or cash flows because the interest on such debt is fixed. As of December 31, 2025, an increase of 100 basis points in interest rates would have decreased the fair value of our fixed-rate debt by approximately $86 million.
As of December 31, 2025, our variable-rate debt obligations consist of U.S. dollar-denominated commercial paper (refer to Note 8 to the consolidated financial statements for information regarding our outstanding indebtedness). As a result, our primary interest rate exposure results from changes in short-term interest rates. As these shorter duration obligations mature, we anticipate issuing additional short-term commercial paper obligations and/or term loans to refinance all or part of these borrowings. The annual effective rate associated with our outstanding variable-rate obligations during the year was approximately 4.1% with interest expense of $36 million. As of December 31, 2025, on an annualized basis, the impact to our interest expense in 2025 from a hypothetical 10 basis points increase in market interest rates on our variable-rate debt obligations would be immaterial.
Foreign Currency Exchange Rate Risk
We face transactional exchange rate risk from transactions with customers in countries outside of the United States and from intercompany transactions between affiliates. Transactional exchange rate risk arises from the purchase and sale of goods and services in currencies other than our functional currency or the functional currency of an applicable subsidiary. We also face translational exchange rate risk related to the translation of financial statements of our foreign operations into U.S. dollars (“USD”), our functional currency. Costs incurred and sales recorded by subsidiaries operating outside of the United States with functional currencies other than the USD, are translated into USD using exchange rates effective during the respective period. As a result, we are exposed to movements in the exchange rates of various currencies against the USD. The effect of a change in currency exchange rates on our net investment in international subsidiaries is reflected in the accumulated other comprehensive income (loss) (“AOCI”) component of equity. A 10% depreciation in major currencies relative to the USD as of December 31, 2025 would have resulted in a reduction of foreign currency-denominated net assets and stockholders’ equity of approximately $179 million.
35
As of December 31, 2025, a portion of the €700 million Euro-denominated senior unsecured notes due 2029 remained designated as a net investment hedge on our investment in applicable foreign operations. We recognized after-tax foreign currency transaction losses of $161.1 million, gains of $60.4 million, and losses of $1.2 million during the years ended December 31, 2025, 2024, and 2023, respectively, on the debt that was deferred in the foreign currency translation component of AOCI as an offset to the foreign currency translation adjustments on our investments in foreign subsidiaries.
Currency exchange rates favorably impacted 2025 reported sales by 0.4% as compared to 2024, as the USD was, on average, weaker against most major currencies during 2025 as compared to exchange rate levels during 2024. If the exchange rates in effect as of December 31, 2025 were to prevail throughout 2026, currency exchange rates would positively impact 2026 estimated sales by approximately 0.8% relative to our performance in 2025. In general, strengthening of the USD against other major currencies negatively impacts our sales and results of operations, while weakening of the USD positively impacts our sales and results of operations.
We have generally accepted the exposure to exchange rate movements without using derivative financial instruments to manage this risk. Both positive and negative movements in currency exchange rates against the U.S. dollar will therefore continue to affect the reported amount of sales, profit, and assets and liabilities in our consolidated financial statements.
Credit Risk
We are exposed to potential credit losses in the event of nonperformance by counterparties to our financial instruments. Financial instruments that potentially subject us to credit risk consist of cash and highly-liquid investment grade cash equivalents and receivables from customers. We place cash and cash equivalents with various high-quality financial institutions throughout the world and exposure is limited at any one institution. Although we typically do not obtain collateral or other security to secure these obligations, we regularly monitor the third party depository institutions that hold our cash and cash equivalents. We emphasize safety and liquidity of principal over yield on those funds. In addition, concentrations of credit risk arising from receivables from customers are limited due to the diversity of our customers. Our businesses perform credit evaluations of their customers’ financial conditions as appropriate and also obtain collateral or other security when appropriate.
Commodity Price Risk
For a discussion of risks relating to commodity prices, refer to “Item 1A. Risk Factors.”
LIQUIDITY AND CAPITAL RESOURCES
We assess our liquidity in terms of our ability to generate cash to fund our operating, investing, and financing activities. We generate substantial cash from operating activities and believe that our operating cash flow and other sources of liquidity, which consist of available cash, our revolving credit facility, and access to commercial paper, bank loans, and capital markets, will be sufficient to allow us to continue funding and investing in our existing businesses, consummate strategic acquisitions, execute strategic separations, repurchase common stock, make interest and principal payments on our outstanding indebtedness, fulfill our contractual obligations, and manage our capital structure on a short and long-term basis.
We have generally satisfied any short-term liquidity needs that are not met through operating cash flows and available cash through issuances of commercial paper under our U.S. dollar and Euro-denominated commercial paper programs (“Commercial Paper Programs”). Credit support for these programs is provided by a five-year $2.0 billion senior unsecured revolving credit facility that expires on October 18, 2027 (the “Revolving Credit Facility”) which, to the extent not otherwise providing credit support for the Commercial Paper Programs, can also be used for working capital and other general corporate purposes. As of December 31, 2025, no borrowings were outstanding under the Revolving Credit Facility. We also may from time to time access the capital markets, including to take advantage of favorable interest rate environments or other market conditions.
The availability of the Revolving Credit Facility as a standby liquidity facility to repay maturing commercial paper is an important factor in maintaining the existing credit ratings of our U.S. dollar-denominated commercial paper program when we have outstanding borrowings. We expect to limit any future borrowings under the Revolving Credit Facility to amounts that would leave sufficient credit available under the facility to allow us to borrow, if needed, and repay any outstanding commercial paper as it matures.
Our ability to access the commercial paper market, and the related costs of these borrowings, is affected by the strength of our credit rating and market conditions. Any downgrade in our credit rating would increase the cost of borrowing under our commercial paper programs and the Credit Agreement, and could limit or preclude our ability to issue commercial paper. If our access to the commercial paper market is adversely affected due to a downgrade, change in market conditions, or otherwise, we would expect to rely on a combination of available cash, operating cash flow, and the Revolving Credit Facility to provide
36
short-term funding. In such event, the cost of borrowings under the Revolving Credit Facility could be higher than the historic cost of commercial paper borrowings.
On June 7, 2023, we filed with the SEC an “automatic shelf” registration statement (the “Shelf Registration Statement”). Under the Shelf Registration Statement, we may from time to time sell shares of common stock, preferred stock, debt securities, depository shares, purchase contracts, purchase units, warrants and subscription rights in one or more offerings.
We continue to monitor the financial markets, the stability of U.S. and international banks and general global economic conditions. In addition, our access to the capital markets and other financing sources is impacted by any change in our credit rating. If changes in financial markets or other areas of the economy or downgrade in our credit rating adversely affect our access to the capital markets and other financing sources, we would expect to rely on a combination of available cash and existing available capacity under our credit facilities to provide short-term funding.
Overview of Cash Flows and Liquidity
Following is an overview of our cash flows and liquidity ($ in millions):
| Year Ended December 31, | |||||||||||||||||
| 2025 | 2024 | 2023 | |||||||||||||||
Total operating cash provided by continuing operations | $ | 1,035.7 | $ | 1,028.5 | $ | 833.4 | |||||||||||
| Purchases of property, plant and equipment | $ | (105.1) | $ | (86.1) | (78.6) | ||||||||||||
| Cash paid for acquisitions, net of cash received | (25.7) | (3.6) | $ | (95.8) | |||||||||||||
| All other investing activities | 11.2 | 0.9 | 1.4 | ||||||||||||||
Total investing cash used in continuing operations | $ | (119.6) | $ | (88.8) | $ | (173.0) | |||||||||||
| Net proceeds from (repayments of) commercial paper borrowings | $ | 0.9 | $ | (596.5) | 839.9 | ||||||||||||
| Repurchase of common shares | (1,610.1) | (889.6) | (272.9) | ||||||||||||||
| Payment of dividends | (92.2) | (111.2) | (102.0) | ||||||||||||||
Proceeds from borrowings (maturities greater than 90 days), net of issuance costs | — | 1,733.5 | $ | 549.3 | |||||||||||||
| Repayment of borrowings (maturities greater than 90 days) | (715.7) | (1,000.0) | (1,000.0) | ||||||||||||||
Proceeds from Ralliant Dividend | 1,150.0 | — | — | ||||||||||||||
| All other financing activities | 40.8 | 71.1 | 18.0 | ||||||||||||||
Total financing cash provided by (used in) continuing operations | $ | (1,226.3) | $ | (792.7) | $ | 32.3 | |||||||||||
Operating Activities
Operating cash flows from continuing operations can fluctuate significantly from period-to-period as working capital needs and the timing of payments for income taxes, interest, pension funding, and other items impact reported cash flows.
Operating cash flows from continuing operations were approximately $1.036 billion in 2025, $1.029 billion in 2024, and $833 million in 2023, representing a year over year increase of $7 million, or 1% in 2025, and $195 million, or 23.4% in 2024, primarily attributable to the following factors:
•Year-over-year increase of $44 million and $97 million in 2025 and 2024, respectively, in Operating cash flow from net earnings, net of non-cash items (Amortization, Depreciation, Stock-based compensation, and Loss from equity investments).
•The aggregate changes in accounts receivable, inventories, and trade accounts payable generated $1.1 million, $28 million, and $9 million of cash during 2025, 2024, and 2023, respectively. The amount of cash flow generated from or used in a period depends upon how effectively we manage the cash conversion cycle, which can be impacted by timing of revenue and collection from customers, vendor cash disbursement, and purchases of materials and components for certain businesses.
•The aggregate change in prepaid expenses and other assets, accrued expenses and other liabilities, and changes in deferred income taxes used $53 million, $42 million, and $122 million of cash in 2025, 2024, and 2023, respectively. The year-over-year changes were driven by timing differences related to contract assets, contract liabilities, payments of income taxes and interest, employee compensation and benefits, and restructuring activities.
37
Investing Activities
Investing cash outflows from continuing operations increased by $31 million in 2025 due to higher capital expenditures and net cash flows related to acquisitions and divestitures. Investing cash outflows from continuing operations decreased by $84 million in 2024 on less acquisition activity than in 2023, partially offset by higher capital expenditures.
Capital expenditures are made primarily for increasing production capacity, replacing aged equipment, supporting product development initiatives for hardware and software offerings, improving information technology systems, and purchasing equipment that is used in revenue arrangements with customers.
Financing Activities and Indebtedness
Financing cash flows from continuing operations consist primarily of the issuance and repayments of debt including commercial paper, payments of cash dividends to shareholders and share repurchases. Financing activities used cash of $1.23 billion in 2025, used cash of $793 million in 2024, and generated cash of $32 million in 2023.
Financing activities during 2025 reflected the following transactions:
•We received a cash dividend of $1.15 billion from Ralliant in connection with the Separation (the “Ralliant Dividend”).
•We borrowed $1 million in net commercial paper activities.
•We repurchased 30 million shares of our common stock for approximately $1.61 billion, with $483 million funded by the Ralliant Dividend and Ralliant Cash Proceeds.
•We made dividend payments to common shareholders totaling $92 million.
•On July 15, 2025, we used approximately $294 million of the Ralliant Dividend to redeem €252 million of the outstanding principal of the 3.7% Euro-denominated senior unsecured notes due 2026.
•On July 24, 2025 and July 25, 2025, we used approximately $421 million of the Ralliant Dividend to repay the outstanding principal of the Euro Term Loan and Yen Term Loan.
•All other financing activities primarily include activities related to the stock incentive plan.
Financing activities during 2024 reflected the following transactions:
•We repaid 597 million in net commercial paper activities.
•We repurchased 12 million shares of our common stock for approximately $890 million.
•We made dividend payments to common shareholders totaling $111 million.
•On January 2, 2024, we drew down an additional $450 million of the Delayed-Draw Term Loan due 2024.
•On February 13, 2024, we completed the sale of our registered offering of the 2026 Notes and the 2029 Notes, yielding net proceeds of approximately $1.3 billion.
•On February 13 2024, we repaid $1.0 billion in outstanding principal of the Delayed-Draw Term Loan due 2024, using net proceeds from the 2026 Notes and 2029 Notes.
•All other financing activities primarily include activities related to the stock incentive plan.
Financing activities during 2023 reflected the following transactions:
•We borrowed $840 million in net commercial paper activities.
•We repurchased 4 million shares of our common stock for approximately $273 million under our share repurchase program.
•We made dividend payments to common shareholders totaling $102 million.
•On December 14, 2023, we drew down $550 million of the $1.3 billion Delayed-Draw Term Loan due 2024.
•On August 24, 2023 and December 14, 2023, we repaid $250 million and $750 million in outstanding principal of the Delayed-Draw Term Loan due 2023, respectively, using the proceeds from the Delayed-Draw Term Loan due 2024 and available cash.
Refer to Note 8 to the consolidated financial statements for additional information regarding the Company’s financing activities and indebtedness and access to additional capital. Refer to Note 14 to the consolidated financial statements for a description of the Company’s share repurchase program.
38
Cash and Cash Requirements
Cash
As of December 31, 2025, we held approximately $376 million of cash and cash equivalents that were invested in highly liquid investment-grade instruments with a maturity of 90 days or less, of which approximately 80% was held outside of the United States.
We have cash requirements to support working capital needs, capital expenditures and acquisitions, pay interest and service debt, pay taxes and any related interest or penalties, fund our pension plans as required, pay dividends to shareholders, and support other business needs or objectives. With respect to our cash requirements, we generally intend to use available cash and internally generated funds to meet these cash requirements, but in the event that additional liquidity is required, particularly in connection with acquisitions and repayment of maturing debt, we may also borrow under our commercial paper programs or credit facilities or enter into new credit facilities and either borrow directly thereunder or use such credit facilities to backstop additional borrowing capacity under our commercial paper programs. We also may from time to time access the capital markets, including to take advantage of favorable interest rate environments or other market conditions.
Cash Requirements
The following table sets forth a summary of our short-term and long-term cash requirements as of December 31, 2025 under (1) long-term debt principal and interest obligations, (2) leases, (3) purchase obligations and (4) other long-term liabilities reflected on our consolidated balance sheet.
| ($ in millions) | Total | Due within one year of December 31, 2025 | Due later than one year from December 31, 2025 | ||||||||||||||
| Debt and leases: | |||||||||||||||||
Long-term debt principal payments (a) | $ | 3,213.5 | $ | 1,191.3 | $ | 2,022.2 | |||||||||||
Interest payments on long-term debt (b) | 657.5 | 105.1 | 552.4 | ||||||||||||||
Operating lease obligations (c) | 106.7 | 25.4 | 81.3 | ||||||||||||||
| Other: | |||||||||||||||||
Purchase obligations (d) | 211.6 | 202.8 | 8.8 | ||||||||||||||
Other liabilities reflected on the balance sheet under GAAP (e)(f) | 1,533.6 | 883.7 | 649.9 | ||||||||||||||
| Total | $ | 5,722.9 | $ | 2,408.3 | $ | 3,314.6 | |||||||||||
(a) The amount due within one year of December 31, 2025 is related to the 3.7% Euro-denominated senior unsecured notes due 2026 and 3.15% senior unsecured notes due 2026. The amount due later than one year from December 31, 2025 includes $650 million outstanding borrowings under the Commercial Paper Programs. Refer to Note 8 to the consolidated financial statements for additional information regarding the Company’s indebtedness as of December 31, 2025. | |||||||||||||||||
(b) Interest payments on long-term debt are projected for future periods using the interest rates in effect as of December 31, 2025. Certain of these projected interest payments may differ in the future based on changes in market interest rates. | |||||||||||||||||
(c) Includes future lease payments for operating leases having initial noncancelable lease terms in excess of one year. | |||||||||||||||||
(d) Consist of agreements to purchase goods or services that are enforceable and legally binding on us and that specify all significant terms, including fixed or minimum quantities to be purchased, fixed, minimum or variable price provisions, and the approximate timing of the transaction. | |||||||||||||||||
(e) Primarily consist of obligations under contract liabilities, post-retirement benefits, pension benefit obligations, net tax liabilities, and deferred compensation obligations. The timing of cash flows associated with these obligations is based upon management’s estimates over the terms of these arrangements and is largely based upon historical experience. Refer to Note 6 to the consolidated financial statements for additional information. | |||||||||||||||||
(f) Includes non-contractual obligations of $159 million of noncurrent gross unrecognized tax benefits, including interest and penalties. However, the timing of these liabilities is uncertain, and therefore, they have been included in the “due later than one year from December 31, 2025” column. Refer to Note 11 to the consolidated financial statements for additional information on unrecognized tax benefits. | |||||||||||||||||
In addition to the obligations noted above, we have issued guarantees, consisting primarily of outstanding standby letters of credit, bank guarantees, and performance and bid bonds, in connection with certain arrangements with vendors, customers, financing counterparties, and governmental entities to secure our obligations and/or performance requirements related to specific transactions. These guarantees are not recorded on our balance sheet and $17 million in commitments expire within one year of December 31, 2025 and $13 million later than one year from December 31, 2025.
39
As of December 31, 2025 we expect to have sufficient liquidity to satisfy our cash needs for the foreseeable future.
CRITICAL ACCOUNTING ESTIMATES
Management’s discussion and analysis of our financial condition and results of operations is based upon our consolidated financial statements, which have been prepared in accordance with GAAP. The preparation of these financial statements requires management to make estimates and judgments that affect the reported amounts of assets, liabilities, revenues and expenses, and related disclosure of contingent assets and liabilities. We base these estimates and judgments on historical experience, the current economic environment, and on various other assumptions that are believed to be reasonable under the circumstances. Actual results may differ materially from these estimates and judgments.
We believe the following accounting estimates are most critical to an understanding of our financial statements. Estimates are considered to be critical if they meet both of the following criteria: (1) the estimate requires assumptions about material matters that are uncertain at the time the estimate is made, and (2) material changes in the estimate are reasonably likely from period to period. For a detailed discussion on the application of these and other accounting estimates, refer to Note 2 to the consolidated financial statements.
Acquired Intangibles and Goodwill: Our business acquisitions typically result in the recognition of goodwill, developed technology, and other intangible assets, which affect the amount of future period amortization expense and possible impairment charges that we may incur. Refer to Notes 2 and 4 to the consolidated financial statements for a description of our policies relating to goodwill, acquired intangibles, and acquisitions.
In performing our goodwill impairment testing, we estimate the fair value of our reporting units primarily using a market based approach. We estimate fair value based on multiples of earnings before interest, taxes, depreciation, and amortization (“EBITDA”) determined by current trading market multiples of earnings for companies operating in businesses similar to each of our reporting units, in addition to recent market available sale transactions of comparable businesses. In evaluating the estimates derived by the market based approach, we make judgments about the relevance and reliability of the multiples by considering factors unique to our reporting units, including operating results, business plans, economic projections, anticipated future cash flows, and transactions and marketplace data as well as judgments about the comparability of the market proxies selected. In certain circumstances we also evaluate other factors including results of the estimated fair value utilizing a discounted cash flow analysis (i.e., an income approach), market positions of the businesses, comparability of market sales transactions, and financial and operating performance in order to validate the results of the market approach. The discounted cash flow model requires judgmental assumptions about projected revenue growth, future operating margins, discount rates, and terminal values. There are inherent uncertainties related to these assumptions and management’s judgment in applying them to the analysis of goodwill impairment.
In 2025, we performed goodwill impairment testing for our reporting units. Our annual goodwill impairment analysis in 2025 indicated that, in all instances, the fair values of our reporting units exceeded their carrying values and consequently did not result in an impairment charge.
The excess of the estimated fair value over carrying value (expressed as a multiple of the carrying value for the respective reporting unit) for each of our reporting units as of the annual testing date ranged from approximately 1.5x to approximately 4.7x. In order to evaluate the sensitivity of the fair value calculations used in the goodwill impairment test, we applied a hypothetical 10% decrease to the fair values of each reporting unit and compared those hypothetical values to the reporting unit carrying values. Based on this hypothetical 10% decrease, the excess of the estimated fair value over carrying value (expressed as a multiple of the carrying value for the respective reporting unit) for each of our reporting units ranged from approximately 1.3x to approximately 4.3x. We evaluated other factors relating to the fair value of the reporting units, including, as applicable, results of the estimated fair value using an income approach, market positions of the businesses, comparability of market sales transactions and financial and operating performance, and concluded no impairment charges were required.
We review identified intangible assets for impairment whenever events or changes in circumstances indicate that the related carrying amounts may not be recoverable. Determining whether an impairment loss occurred for intangible assets with definite lives requires a comparison of the carrying amount to the sum of undiscounted cash flows expected to be generated by the asset. We also test intangible assets with indefinite lives at least annually for impairment. These analyses require management to make judgments and estimates about future revenues, expenses, market conditions, and discount rates related to these assets. We evaluated events or circumstances that may indicate the carrying value of our intangible assets may not be fully recoverable during the year ended December 31, 2025, and recorded no impairments.
If actual results are not consistent with management’s estimates and assumptions, goodwill and other intangible assets may be overstated and a charge would need to be taken against net earnings which would adversely affect our financial statements.
40
Revenue Recognition: We derive revenue from the sale of products and services. Revenue is recognized when control over the promised products or services is transferred to the customer in an amount that reflects the consideration that we expect to receive in exchange for those goods or services. In determining if control has transferred, we consider whether certain indicators of the transfer of control are present, such as the transfer of title, present right to payment, significant risks and rewards of ownership, and customer acceptance when acceptance is not a formality. To determine the consideration that the customer owes us, we make judgments regarding the amount of customer allowances and rebates, consisting primarily of volume discounts and other short-term incentive programs. Refer to Note 2 to the consolidated financial statements for a description of our revenue recognition policies.
If our judgments regarding revenue recognition prove incorrect, our reported revenues in particular periods may be adversely affected. Historically, our estimates of revenue have been materially correct.
Income Taxes: For a description of our income tax accounting policies, refer to Note 2 and Note 11 to the consolidated financial statements.
In accordance with GAAP, deferred tax assets and liabilities are determined based on the difference between the financial statement and tax basis of assets and liabilities using enacted rates expected to be in effect during the year in which the differences reverse. Deferred tax assets generally represent items that can be used as a tax deduction or credit in our tax return in future years for which the tax benefit has already been reflected in our Consolidated Statements of Earnings. Deferred tax liabilities generally represent items that have already been taken as a deduction on our tax return but have not yet been recognized as an expense in our Consolidated Statements of Earnings. The effect on deferred tax assets and liabilities due to a change in tax rates is recognized in income tax expense in the period that includes the enactment date.
Our deferred tax assets are reduced by a valuation allowance if, based on the weight of available evidence, it is more likely than not (a likelihood of more than 50 percent) that some portion or all of the deferred tax assets will not be realized. We evaluate the realizability of deferred income tax assets for each of the jurisdictions in which we operate. If we experience cumulative pretax income in a particular jurisdiction in the three-year period including the current and prior two years, we normally conclude that the deferred income tax assets will more likely than not be realizable and no valuation allowance is recognized, unless known or planned operating developments would lead management to conclude otherwise. However, if we experience cumulative pretax losses in a particular jurisdiction in the three-year period including the current and prior two years, we then consider a series of factors in the determination of whether the deferred income tax assets can be realized. These factors include historical operating results, known or planned operating developments, the period of time over which certain temporary differences will reverse, consideration of the utilization of certain deferred income tax liabilities, tax law carryback capability in the particular country, and prudent and feasible tax planning strategies. After evaluation of these factors, if the deferred income tax assets are expected to be realized within the tax carryforward period allowed for that specific country, we would conclude that no valuation allowance would be required. To the extent that the deferred income tax assets exceed the amount that is expected to be realized within the tax carryforward period for a particular jurisdiction, we establish a valuation allowance.
We recognize tax benefits from uncertain tax positions only if, in our assessment, it is more likely than not that the tax position will be sustained on examination by the taxing authorities, based on the technical merits of the position. The tax benefits recognized in the financial statements from such positions are measured based on the largest benefit that has a greater than 50% likelihood of being realized upon ultimate settlement. Judgment is required in evaluating tax positions and determining income tax provisions. We re-evaluate the technical merits of our tax positions and may recognize an uncertain tax benefit in certain circumstances, including when: (i) a tax audit is completed; (ii) applicable tax laws change, including a tax case ruling or legislative guidance; or (iii) the applicable statute of limitations expires. We recognize potential accrued interest and penalties with unrecognized tax positions in income tax expense.
In addition, we are routinely examined by various domestic and international taxing authorities. The amount of income taxes we pay is subject to audit by federal, state, and foreign tax authorities, which may result in proposed assessments (see “-Results of Operations - Income Taxes” and Note 11 to the consolidated financial statements). We review our global tax positions on a quarterly basis. Based on these reviews, the results of discussions and resolutions of matters with certain tax authorities, tax rulings, and court decisions and the expiration of statutes of limitations reserves for contingent tax liabilities are accrued or adjusted as necessary.
An increase in our 2025 effective tax rate of 1.0% would have resulted in an additional income tax provision for the year ended December 31, 2025 of approximately $6 million.
NEW ACCOUNTING STANDARDS
For a discussion of new accounting standards relevant to our businesses, refer to Note 2 to the consolidated financial statements.
41
ITEM 7A. QUANTITATIVE AND QUALITATIVE DISCLOSURES ABOUT MARKET RISK
The information required by this item is included under the heading “Financial Instruments and Risk Management” in “Item 7. Management’s Discussion and Analysis of Financial Condition and Results of Operations.”
42
ITEM 8. FINANCIAL STATEMENTS AND SUPPLEMENTARY DATA
Report of Management on Fortive Corporation’s Internal Control Over Financial Reporting
The management of the Company is responsible for establishing and maintaining adequate internal control over financial reporting for the Company. Internal control over financial reporting is defined in Rules 13a-15(f) and 15d-15(f) promulgated under the Securities Exchange Act of 1934.
The Company’s management assessed the effectiveness of the Company’s internal control over financial reporting as of December 31, 2025. In making this assessment, the Company’s management used the criteria set forth by the Committee of Sponsoring Organizations of the Treadway Commission (“COSO”) in “Internal Control-Integrated Framework” (2013 framework). Based on this assessment, management concluded that, as of December 31, 2025, the Company’s internal control over financial reporting is effective.
The Company’s independent registered public accounting firm has issued an audit report on the effectiveness of the Company’s internal control over financial reporting. This report dated February 25, 2026 appears on page 44 of this Form 10-K.
43
Report of Independent Registered Public Accounting Firm
To the Stockholders and the Board of Directors of Fortive Corporation
Opinion on Internal Control Over Financial Reporting
We have audited Fortive Corporation and subsidiaries’ internal control over financial reporting as of December 31, 2025, based on criteria established in Internal Control-Integrated Framework issued by the Committee of Sponsoring Organizations of the Treadway Commission (2013 framework), (the COSO criteria). In our opinion, Fortive Corporation and subsidiaries (the Company) maintained, in all material respects, effective internal control over financial reporting as of December 31, 2025, based on the COSO criteria.
We also have audited, in accordance with the standards of the Public Company Accounting Oversight Board (United States) (PCAOB), the consolidated balance sheets of the Company as of December 31, 2025 and 2024, the related consolidated statements of earnings, comprehensive income, changes in equity and cash flows for each of the three years in the period ended December 31, 2025, and the related notes and financial statement schedule listed in the Index at Item 15(a)(2) and our report dated February 25, 2026 expressed an unqualified opinion thereon.
Basis for Opinion
The Company’s management is responsible for maintaining effective internal control over financial reporting and for its assessment of the effectiveness of internal control over financial reporting included in the accompanying Report of Management on Fortive Corporation’s Internal Control Over Financial Reporting. Our responsibility is to express an opinion on the Company’s internal control over financial reporting based on our audit. We are a public accounting firm registered with the PCAOB and are required to be independent with respect to the Company in accordance with the U.S. federal securities laws and the applicable rules and regulations of the Securities and Exchange Commission and the PCAOB.
We conducted our audit in accordance with the standards of the PCAOB. Those standards require that we plan and perform the audit to obtain reasonable assurance about whether effective internal control over financial reporting was maintained in all material respects.
Our audit included obtaining an understanding of internal control over financial reporting, assessing the risk that a material weakness exists, testing and evaluating the design and operating effectiveness of internal control based on the assessed risk, and performing such other procedures as we considered necessary in the circumstances. We believe that our audit provides a reasonable basis for our opinion.
Definition and Limitations of Internal Control Over Financial Reporting
A company’s internal control over financial reporting is a process designed to provide reasonable assurance regarding the reliability of financial reporting and the preparation of financial statements for external purposes in accordance with generally accepted accounting principles. A company’s internal control over financial reporting includes those policies and procedures that (1) pertain to the maintenance of records that, in reasonable detail, accurately and fairly reflect the transactions and dispositions of the assets of the company; (2) provide reasonable assurance that transactions are recorded as necessary to permit preparation of financial statements in accordance with generally accepted accounting principles, and that receipts and expenditures of the company are being made only in accordance with authorizations of management and directors of the company; and (3) provide reasonable assurance regarding prevention or timely detection of unauthorized acquisition, use, or disposition of the company’s assets that could have a material effect on the financial statements.
Because of its inherent limitations, internal control over financial reporting may not prevent or detect misstatements. Also, projections of any evaluation of effectiveness to future periods are subject to the risk that controls may become inadequate because of changes in conditions, or that the degree of compliance with the policies or procedures may deteriorate.
/s/ Ernst & Young LLP
February 25, 2026
44
Report of Independent Registered Public Accounting Firm
To the Stockholders and the Board of Directors of Fortive Corporation
Opinion on the Financial Statements
We have audited the accompanying consolidated balance sheets of Fortive Corporation and subsidiaries (the Company) as of December 31, 2025 and 2024, the related consolidated statements of earnings, comprehensive income, changes in equity and cash flows for each of the three years in the period ended December 31, 2025, and the related notes and financial statement schedule listed in the Index at Item 15(a)(2) (collectively referred to as the “consolidated financial statements”). In our opinion, the consolidated financial statements present fairly, in all material respects, the financial position of the Company at December 31, 2025 and 2024, and the results of its operations and its cash flows for each of the three years in the period ended December 31, 2025, in conformity with U.S. generally accepted accounting principles.
We also have audited, in accordance with the standards of the Public Company Accounting Oversight Board (United States) (PCAOB), the Company's internal control over financial reporting as of December 31, 2025, based on criteria established in Internal Control-Integrated Framework issued by the Committee of Sponsoring Organizations of the Treadway Commission (2013 framework) and our report dated February 25, 2026 expressed an unqualified opinion thereon.
Basis for Opinion
These financial statements are the responsibility of the Company's management. Our responsibility is to express an opinion on the Company’s financial statements based on our audits. We are a public accounting firm registered with the PCAOB and are required to be independent with respect to the Company in accordance with the U.S. federal securities laws and the applicable rules and regulations of the Securities and Exchange Commission and the PCAOB.
We conducted our audits in accordance with the standards of the PCAOB. Those standards require that we plan and perform the audit to obtain reasonable assurance about whether the financial statements are free of material misstatement, whether due to error or fraud. Our audits included performing procedures to assess the risks of material misstatement of the financial statements, whether due to error or fraud, and performing procedures that respond to those risks. Such procedures included examining, on a test basis, evidence regarding the amounts and disclosures in the financial statements. Our audits also included evaluating the accounting principles used and significant estimates made by management, as well as evaluating the overall presentation of the financial statements. We believe that our audits provide a reasonable basis for our opinion.
Critical Audit Matter
The critical audit matter communicated below is a matter arising from the current period audit of the financial statements that was communicated or required to be communicated to the audit committee and that: (1) relates to accounts or disclosures that are material to the financial statements and (2) involved our especially challenging, subjective or complex judgments. The communication of the critical audit matter does not alter in any way our opinion on the consolidated financial statements, taken as a whole, and we are not, by communicating the critical audit matter below, providing separate opinion on the critical audit matter or on the accounts or disclosures to which it relates.
Description of the Matter | Accounting for indefinite-lived intangible assets As discussed in Note 2 and 4 to the consolidated financial statements, the Company has $309.9 million of indefinite-lived intangible assets. Auditing the Company's accounting for its evaluation of potential impairment was complex due to the estimation uncertainty in determining the fair value of a certain indefinite-lived intangible asset. The significant assumption used to estimate the value of this asset was forecasted revenues. This assumption is forward-looking and could be affected by future economic and market conditions. | ||||
| How We Addressed the Matter in Our Audit | We tested the Company's controls over its accounting for the impairment analysis, including controls over management’s review of the significant assumption, described above. To test the estimated fair value of the indefinite-lived intangible asset, we performed audit procedures that included, among others, involving our valuation specialists to assist in evaluating the Company's use of the selected valuation model, testing the significant assumption used in the model and testing the completeness and accuracy of the underlying data. For example, we compared the revenue growth rate selected by management to publicly available market data and historical results of the Company’s business. We also performed a sensitivity analysis of the significant assumption to evaluate the change in the fair value of the indefinite-lived intangible asset resulting from changes in the assumption. | ||||
45
/s/ Ernst & Young LLP
We have served as the Company’s auditor since 2015.
Seattle, Washington
February 25, 2026
46
FORTIVE CORPORATION AND SUBSIDIARIES
CONSOLIDATED BALANCE SHEETS
($ and shares in millions, except per share amounts)
As of December 31, | |||||||||||
| 2025 | 2024 | ||||||||||
| ASSETS | |||||||||||
| Current assets: | |||||||||||
| Cash and equivalents | $ | $ | |||||||||
Accounts receivable less allowance for doubtful accounts of $ | |||||||||||
| Inventories: | |||||||||||
| Finished goods | |||||||||||
| Work in process | |||||||||||
| Raw materials | |||||||||||
| Inventories | |||||||||||
| Prepaid expenses and other current assets | |||||||||||
| Current assets, discontinued operations | |||||||||||
| Total current assets | |||||||||||
| Property, plant and equipment, net | |||||||||||
| Other assets | |||||||||||
| Goodwill | |||||||||||
| Other intangible assets, net | |||||||||||
| Other assets, discontinued operations | |||||||||||
| Total assets | $ | $ | |||||||||
| LIABILITIES AND EQUITY | |||||||||||
| Current liabilities: | |||||||||||
| Current portion of long-term debt | $ | $ | |||||||||
| Trade accounts payable | |||||||||||
| Accrued expenses and other current liabilities | |||||||||||
| Current liabilities, discontinued operations | |||||||||||
| Total current liabilities | |||||||||||
| Other long-term liabilities | |||||||||||
| Long-term debt | |||||||||||
| Long-term liabilities, discontinued operations | |||||||||||
Commitments and Contingencies (Note 12) | |||||||||||
| Equity: | |||||||||||
Common stock: $ | |||||||||||
| Additional paid-in capital | |||||||||||
| Treasury shares, at cost | ( | ( | |||||||||
| Retained earnings | |||||||||||
Accumulated other comprehensive income (loss) | ( | ||||||||||
| Total Fortive stockholders’ equity | |||||||||||
| Noncontrolling interests | |||||||||||
| Total stockholders’ equity | |||||||||||
| Total liabilities and equity | $ | $ | |||||||||
See the accompanying Notes to the Consolidated Financial Statements.
47
FORTIVE CORPORATION AND SUBSIDIARIES
CONSOLIDATED STATEMENTS OF EARNINGS
($ and shares in millions, except per share amounts)
Year Ended December 31, | |||||||||||||||||
| 2025 | 2024 | 2023 | |||||||||||||||
| Sales: | |||||||||||||||||
| Products and software | $ | $ | $ | ||||||||||||||
| Services | |||||||||||||||||
| Total sales | |||||||||||||||||
| Cost of Sales: | |||||||||||||||||
| Products and software | ( | ( | ( | ||||||||||||||
| Services | ( | ( | ( | ||||||||||||||
| Total cost of sales | ( | ( | ( | ||||||||||||||
| Gross profit | |||||||||||||||||
| Operating costs: | |||||||||||||||||
Selling, general, and administrative | ( | ( | ( | ||||||||||||||
Research and development | ( | ( | ( | ||||||||||||||
| Operating profit | |||||||||||||||||
| Non-operating income (expense), net: | |||||||||||||||||
| Interest expense, net | ( | ( | ( | ||||||||||||||
Other non-operating income (expenses), net | ( | ( | |||||||||||||||
Earnings from continuing operations before income taxes | |||||||||||||||||
| Income taxes | ( | ( | ( | ||||||||||||||
| Net earnings from continuing operations | |||||||||||||||||
Net earnings from discontinued operations | |||||||||||||||||
| Net earnings | $ | $ | $ | ||||||||||||||
| Net earnings per common share from continuing operations: | |||||||||||||||||
| Basic | $ | $ | $ | ||||||||||||||
| Diluted | $ | $ | $ | ||||||||||||||
| Net earnings per common share from discontinued operations: | |||||||||||||||||
| Basic | $ | $ | $ | ||||||||||||||
| Diluted | $ | $ | $ | ||||||||||||||
| Net earnings per common share: | |||||||||||||||||
| Basic | $ | $ | $ | ||||||||||||||
| Diluted | $ | $ | $ | ||||||||||||||
| Average common stock and common equivalent shares outstanding: | |||||||||||||||||
| Basic | |||||||||||||||||
| Diluted | |||||||||||||||||
Certain amounts may not sum due to rounding. | |||||||||||||||||
See the accompanying Notes to the Consolidated Financial Statements.
48
FORTIVE CORPORATION AND SUBSIDIARIES
CONSOLIDATED STATEMENTS OF COMPREHENSIVE INCOME
($ in millions)
| Year Ended December 31 | |||||||||||||||||
| 2025 | 2024 | 2023 | |||||||||||||||
| Net earnings | $ | $ | $ | ||||||||||||||
| Other comprehensive income (loss), net of income taxes: | |||||||||||||||||
| Foreign currency translation adjustments | ( | ||||||||||||||||
| Pension and post-retirement plan benefit adjustments | ( | ||||||||||||||||
| Total other comprehensive income (loss), net of income taxes | ( | ( | |||||||||||||||
| Comprehensive income | $ | $ | $ | ||||||||||||||
See the accompanying Notes to the Consolidated Financial Statements.
49
FORTIVE CORPORATION AND SUBSIDIARIES
CONSOLIDATED STATEMENTS OF CHANGES IN EQUITY
($ and shares in millions)
| Common Stock | Additional Paid-In Capital | Treasury Shares | Retained Earnings | Accumulated Other Comprehensive Income (Loss) | Noncontrolling Interests | ||||||||||||||||||||||||||||||||||||
| Shares Outstanding | Amount | ||||||||||||||||||||||||||||||||||||||||
| Balance, December 31, 2022 | $ | $ | $ | ( | $ | $ | ( | $ | |||||||||||||||||||||||||||||||||
| Net earnings for the period | — | — | — | — | — | — | |||||||||||||||||||||||||||||||||||
Dividends to common stockholders | — | — | — | — | ( | — | — | ||||||||||||||||||||||||||||||||||
Other comprehensive income (loss) | — | — | — | — | — | ( | — | ||||||||||||||||||||||||||||||||||
Stock-based compensation | — | — | — | — | — | ||||||||||||||||||||||||||||||||||||
Common stock repurchases | ( | — | — | ( | — | — | — | ||||||||||||||||||||||||||||||||||
| Shares withheld for taxes | ( | — | ( | — | — | — | — | ||||||||||||||||||||||||||||||||||
| Change in noncontrolling interests | — | — | — | — | — | — | |||||||||||||||||||||||||||||||||||
| Balance, December 31, 2023 | $ | $ | $ | ( | $ | $ | ( | $ | |||||||||||||||||||||||||||||||||
| Net earnings for the period | — | — | — | — | — | — | |||||||||||||||||||||||||||||||||||
| Dividends to common stockholders | — | — | — | — | ( | — | — | ||||||||||||||||||||||||||||||||||
Other comprehensive income (loss) | — | — | — | — | — | ( | — | ||||||||||||||||||||||||||||||||||
Stock-based compensation | — | — | — | — | |||||||||||||||||||||||||||||||||||||
Common stock repurchases | ( | — | — | ( | — | — | — | ||||||||||||||||||||||||||||||||||
| Shares withheld for taxes | ( | — | ( | — | — | — | — | ||||||||||||||||||||||||||||||||||
| Change in noncontrolling interests | — | — | — | — | — | — | |||||||||||||||||||||||||||||||||||
| Balance, December 31, 2024 | $ | $ | $ | ( | $ | $ | ( | $ | |||||||||||||||||||||||||||||||||
| Net earnings for the period | — | — | — | — | — | — | |||||||||||||||||||||||||||||||||||
| Dividends to common stockholders | — | — | — | — | ( | — | — | ||||||||||||||||||||||||||||||||||
Other comprehensive income (loss) | — | — | — | — | — | — | |||||||||||||||||||||||||||||||||||
Stock-based compensation | — | — | — | — | |||||||||||||||||||||||||||||||||||||
Common stock repurchases | ( | — | — | ( | — | — | — | ||||||||||||||||||||||||||||||||||
| Shares withheld for taxes | ( | — | ( | — | — | — | — | ||||||||||||||||||||||||||||||||||
| Change in noncontrolling interests | — | — | — | — | — | — | |||||||||||||||||||||||||||||||||||
Distribution of Ralliant Corporation | — | — | — | — | ( | — | |||||||||||||||||||||||||||||||||||
| Balance, December 31, 2025 | $ | $ | $ | ( | $ | $ | $ | ||||||||||||||||||||||||||||||||||
See the accompanying Notes to the Consolidated Financial Statements.
50
FORTIVE CORPORATION AND SUBSIDIARIES
CONSOLIDATED STATEMENTS OF CASH FLOWS
($ in millions)
| Year Ended December 31 | |||||||||||||||||
| 2025 | 2024 | 2023 | |||||||||||||||
| Cash flows from operating activities: | |||||||||||||||||
Net earnings | $ | $ | $ | ||||||||||||||
Less: net earnings from discontinued operations | ( | ( | ( | ||||||||||||||
Net earnings from continuing operations | $ | ||||||||||||||||
| Adjustments to reconcile net earnings to net cash provided by operating activities: | |||||||||||||||||
| Amortization | |||||||||||||||||
| Depreciation | |||||||||||||||||
| Stock-based compensation | |||||||||||||||||
| Loss from equity investments | |||||||||||||||||
| Change in certain assets and liabilities: | |||||||||||||||||
| Change in deferred income taxes | ( | ( | ( | ||||||||||||||
| Change in accounts receivable, net | ( | ( | |||||||||||||||
| Change in inventories | ( | ( | |||||||||||||||
| Change in trade accounts payable | |||||||||||||||||
| Change in prepaid expenses and other assets | ( | ( | |||||||||||||||
| Change in accrued expenses and other liabilities | ( | ||||||||||||||||
| Total operating cash provided by continuing operations | |||||||||||||||||
Total operating cash provided by discontinued operations | |||||||||||||||||
| Net cash provided by operating activities | |||||||||||||||||
| Cash flows from investing activities: | |||||||||||||||||
| Purchases of property, plant and equipment | ( | ( | ( | ||||||||||||||
| Cash paid for acquisitions, net of cash received | ( | ( | ( | ||||||||||||||
| All other investing activities | |||||||||||||||||
| Total investing cash used in continuing operations | ( | ( | ( | ||||||||||||||
| Total investing cash used in discontinued operations | ( | ( | ( | ||||||||||||||
| Net cash used in investing activities | ( | ( | ( | ||||||||||||||
| Cash flows from financing activities: | |||||||||||||||||
| Net proceeds from (repayments of) commercial paper borrowings | ( | ||||||||||||||||
| Repurchase of common shares | ( | ( | ( | ||||||||||||||
| Payment of dividends | ( | ( | ( | ||||||||||||||
| Proceeds from borrowings (maturities greater than 90 days), net of issuance costs | |||||||||||||||||
| Repayment of borrowings (maturities greater than 90 days) | ( | ( | ( | ||||||||||||||
Proceeds from Ralliant Dividend | |||||||||||||||||
| All other financing activities | |||||||||||||||||
| Total financing cash (used in) provided by continuing operations | ( | ( | |||||||||||||||
| Total financing cash used in discontinued operations | ( | ||||||||||||||||
Net cash provided by (used in) financing activities | ( | ( | |||||||||||||||
| Effect of exchange rate changes on cash and equivalents | ( | ( | |||||||||||||||
| Net change in cash and equivalents | ( | ( | |||||||||||||||
| Beginning balance of cash and equivalents | |||||||||||||||||
| Ending balance of cash and equivalents | $ | $ | $ | ||||||||||||||
See the accompanying Notes to the Consolidated Financial Statements.
51
NOTES TO THE CONSOLIDATED FINANCIAL STATEMENTS
NOTE 1. BUSINESS OVERVIEW AND BASIS FOR PRESENTATION
Fortive Corporation (“Fortive,” “the Company,” “we,” “us,” or “our”) innovates essential technologies to keep our world safe and productive. Our strategic segments - Intelligent Operating Solutions (“IOS”) and Advanced Healthcare Solutions (“AHS”) - include iconic inventor brands with leading positions in their markets. Our businesses design, develop, manufacture, and market products, software, and services, building upon leading brand names, innovative technologies, and strong market positions. Our research and development, manufacturing, sales, distribution, service, and administrative facilities are located in approximately 50 countries around the world.
Basis of Presentation
The accompanying consolidated financial statements present our historical financial position, results of operations, changes in equity and cash flows in accordance with accounting principles generally accepted in the United States of America (“GAAP”).
The financial statements include our accounts and the accounts of our subsidiaries. All intercompany balances and transactions have been eliminated upon consolidation. The consolidated financial statements also reflect the impact of noncontrolling interests. Noncontrolling interests do not have a significant impact on our consolidated results of operations; therefore, net earnings and net earnings per share attributable to noncontrolling interests are not presented separately in our Consolidated Statements of Earnings. Net earnings attributable to noncontrolling interests have been reflected in Selling, general, and administrative expenses and were insignificant in all periods presented. Certain of our operations have been presented as discontinued operations. We present businesses whose disposal represents a strategic shift that has, or will have, a major effect on our operations and financial results as discontinued operations when the components meet the criteria for held for sale, are sold, or spun-off.
Segment Presentation
We operate and report our results in two segments, Intelligent Operating Solutions and Advanced Healthcare Solutions, each of which is further described below.
Our IOS segment provides advanced instrumentation, software and services to tens of thousands of customers enabling their mission-critical workflows. These offerings include professional instruments used in applications including maintenance, repair, measurement and condition monitoring, facility and asset lifecycle software applications, connected worker safety and compliance solutions across a range of vertical end markets, including manufacturing, process industries, healthcare, utilities and power, communications and electronics, among others. Typical users of these safety, productivity and sustainability solutions include electrical engineers, electricians, electronic technicians, EHS professionals, network technicians, facility managers, first-responders, and maintenance professionals.
Our AHS segment supplies critical workflow solutions enabling healthcare providers to deliver exceptional patient care more efficiently. Our offerings include instrument sterilization solutions, instrument tracking, biomedical test tools, radiation detection and safety monitoring, and end-to-end clinical productivity software and solutions. Our healthcare offerings help ensure critical safety standards are met, instruments and operating rooms are working at peak performance, and complex procedures are followed accurately in these mission-critical healthcare environments.
Precision Technologies Separation
On June 28, 2025 (the “Distribution Date”), the Company completed the separation (the “Separation” or the “PT Separation”) of its former Precision Technologies segment by distributing to Fortive shareholders on a pro rata basis all of the issued and outstanding common stock of Ralliant Corporation (“Ralliant”), the entity incorporated to hold the PT businesses. The accounting requirements for reporting Ralliant as a discontinued operation were met when the Separation was completed. Accordingly, the accompanying consolidated financial statements for all periods presented reflect this business as a discontinued operation. Unless otherwise indicated, all references in this Annual Report refer to continuing operations. Refer to Note 3 of the consolidated financial statements for additional information.
Acquisitions
During the year ended December 31, 2025, we made two acquisitions, one in each of our segments, with aggregate cash consideration totaling $25.7 million, net of acquired cash. These acquisitions are intended to accelerate our strategy and strengthen our product portfolio to provide world-class solutions to our customers. We recorded approximately $15.9 million of goodwill, which is not tax deductible, and $11.4 million of intangible assets consisting of customer relationships, technology, and trade names. All other acquired assets and assumed liabilities are immaterial.
52
NOTE 2. SUMMARY OF SIGNIFICANT ACCOUNTING POLICIES
Use of Estimates—The preparation of financial statements in conformity with GAAP requires management to make estimates and judgments that affect the reported amounts of assets, liabilities, revenues and expenses, and related disclosure of contingent assets and liabilities. We base these estimates on historical experience, the current economic environment, and on various other assumptions that are believed to be reasonable under the circumstances. However, uncertainties associated with these estimates exist and actual results may differ from these estimates.
Cash and Equivalents—We consider all highly liquid investments with a maturity of three months or less at the date of purchase to be cash equivalents.
Accounts Receivable and Allowances for Doubtful Accounts—We measure our allowance to reflect expected credit losses over the remaining contractual life of the asset. Expected credit losses for the pooled assets are estimated based on historical loss experience, credit quality, the durations of outstanding account receivables, and expectations of the future economic environment. Expected credit losses of the assets originating during the year and changes to expected losses in the same period are recognized in earnings.
All trade accounts and unbilled receivables are recorded within the Consolidated Balance Sheet, adjusted for any write-offs, and net of allowances for credit losses. We regularly perform detailed reviews of our portfolios to evaluate the collectability of receivables based on a combination of past, current, and future financial and qualitative factors that may affect customers’ ability to pay. In circumstances where we are aware of a specific customer’s inability to meet its financial obligations, a specific reserve is recorded against amounts due to reduce the recognized receivable to the amount reasonably expected to be collected. Amounts determined to be uncollectible are charged directly against the allowances.
The allowance for doubtful accounts as well as the provision for credit losses, write-off activity and recoveries for the periods presented were immaterial. We do not believe that accounts receivable represent significant concentrations of credit risk because of the diversified portfolio of individual customers and geographical areas.
The allowance for unbilled receivables was immaterial for all periods.
Inventory Valuation—Inventories include the costs of material, labor, and overhead. Substantially all inventories are stated at the lower of cost or net realizable value using the first-in, first-out (“FIFO”) method.
Property, Plant, and Equipment—Property, plant, and equipment are carried at cost. The provision for depreciation has been computed principally by the straight-line method based on the estimated useful lives of the depreciable assets as follows:
| Category | Useful Life | |||||||
| Buildings | ||||||||
| Leased assets and leasehold improvements | Amortized over the lesser of the economic life of the asset or the term of the lease | |||||||
| Machinery, equipment and other | ||||||||
The classes of property, plant and equipment as of December 31 are summarized as follows ($ in millions):
| 2025 | 2024 | ||||||||||
| Land and improvements | $ | $ | |||||||||
| Buildings and leasehold improvements | |||||||||||
| Machinery, equipment and other | |||||||||||
| Gross property, plant and equipment | |||||||||||
| Less: accumulated depreciation | ( | ( | |||||||||
| Property, plant and equipment, net | $ | $ | |||||||||
Property, plant, and equipment are reviewed for impairment whenever events or changes in business circumstances indicate the carrying value of the assets may not be recoverable. Impairment losses are recognized based on estimated fair values if the sum of estimated future undiscounted cash flows of the related assets is less than the carrying values. There were no
Investments—We account for our equity investments using either the measurement alternative approach when the fair value of the investment is not readily determinable and we do not have the ability to exercise significant influence, or the equity method of accounting when it is determined that we have significant influence over but do not have a controlling financial interest.
53
Investments accounted for using the measurement alternative approach are initially recorded at cost and adjusted for changes in the fair value from observable transactions. For investments accounted for using the equity method of accounting, we record the investments at cost and subsequently adjust the investment balance each period for our share of the investee’s income or loss and dividends received from the investee. These investments are subject to a periodic impairment review. There were no material impairment losses during the years ended December 31, 2025, 2024, or 2023.
There was no loss from equity investments during the year ended December 31, 2025. We recorded a loss from equity investments of $39.4 million and $17.3 million during the years ended December 31, 2024 and 2023, respectively. The losses are recorded within Other non-operating expense, net in our Consolidated Statement of Earnings.
Other Assets—Other assets principally include operating lease right-of-use assets, contract assets, deferred tax assets, and other investments.
Revenue Recognition—We derive revenue from the sale of products and services. Revenue is recognized when control of promised products or services is transferred to customers in an amount that reflects the consideration we expect to be entitled to in exchange for those products or services.
Product sales include revenue from the sale of products and equipment, which includes our software and software as a service (“SaaS”) product offerings and equipment rentals.Service sales include revenues from extended warranties, post-contract customer support (“PCS”), maintenance contracts or services, contract labor to perform ongoing service at a customer location, services related to previously sold products, and software implementation services.
For revenue related to a product or service to qualify for recognition, we must have an enforceable contract with a customer that defines the goods or services to be transferred and the payment terms related to those goods or services. Further, collection of substantially all consideration for the goods or services transferred must be probable based on the customer’s intent and ability to pay the promised consideration. We apply judgment in determining the customer’s ability and intention to pay, which is based on a combination of financial and qualitative factors, including the customer’s financial condition, collateral, debt-servicing ability, past payment experience, and credit bureau information.
Customer allowances and rebates, consisting primarily of volume discounts and other short-term incentive programs, are considered in determining the transaction price for the contract. These allowances and rebates are reflected as a reduction in the contract transaction price. Judgment is exercised in determining product returns, customer allowances, and rebates, and are estimated based on historical experience and known trends.
Most of our sales contracts contain standard terms and conditions. We evaluate contracts to identify distinct goods and services promised in the contract (performance obligations). Sometimes this evaluation involves judgment to determine whether the goods or services are highly dependent on or highly interrelated with one another, or whether such goods or services significantly modify or customize one another. Certain customer arrangements include multiple performance obligations, typically hardware, software, SaaS, implementation/installation, training, consulting, other services, and/or PCS. Generally, these elements are delivered within the same reporting period, except SaaS, PCS, and other services. We allocate the contract transaction price to each performance obligation on a relative standalone selling price basis. We estimate standalone selling price using the observable price that the good or service sells for separately in similar circumstances and to similar customers or, if observable price is not available, other methods. Allocating the transaction price to each performance obligation sometimes requires significant judgment.
Revenue from sales of hardware is recognized when control transfers to the customer, which is generally when the product is shipped. If any significant obligation to the customer with respect to a sales transaction remains to be fulfilled following
54
shipment (typically installation, other services noted above, or acceptance by the customer), revenue recognition is deferred until such obligations have been fulfilled. Further, revenue related to separately priced extended warranty and product maintenance agreements is deferred when appropriate and recognized as revenue over the term of the agreement.
Shipping and Handling—Shipping and handling costs are included as a component of Cost of sales in the Consolidated Statements of Earnings. Revenue derived from shipping and handling costs billed to customers is included in Sales of products in the Consolidated Statements of Earnings.
Advertising—Advertising costs are expensed as incurred.
Research and Development—We conduct research and development activities for the purpose of developing new products, enhancing the functionality, effectiveness, ease of use, and reliability of our existing products, and expanding the applications for which uses of our products are appropriate. Research and development costs are expensed as incurred.
Restructuring—We may initiate restructuring activities to appropriately position our cost base relative to prevailing economic conditions and associated customer demand, as well as in connection with certain acquisitions. Costs associated with restructuring actions can include one-time termination benefits and related charges, facility closure costs, contract termination, and other related activities. We record the cost of the restructuring activities when the associated liability is incurred.
In the fourth quarter of 2024, we initiated a discrete restructuring plan that was initially expected to be completed by December 31, 2025, and has been extended through the second half of 2026. The nature of the plan is related to the Separation and consisted primarily of targeted workforce reductions to realign cost structures. During 2023, we initiated and completed a separate discrete restructuring plan that was completed by the end of 2023. The nature of the activities in 2023 was broadly consistent throughout our segments and consisted primarily of targeted workforce reductions in response to overall macroeconomic and other external conditions.
We incurred charges of $32 million, $10 million, and $38 million during the years ended December 31, 2025, 2024, and 2023, respectively. These charges are recorded within in the Consolidated Statements of Earnings. Accrued restructuring costs were approximately $13 million and $7 million as of December 31, 2025 and 2024, respectively, and are recorded within Accrued expenses and other current liabilities in the Consolidated Balance Sheets.
Income Taxes—In accordance with GAAP, deferred tax assets and liabilities are determined based on the difference between the financial statement and tax basis of assets and liabilities using enacted rates expected to be in effect during the year in which the differences reverse. Deferred tax assets generally represent items that can be used as a tax deduction or credit in our tax return in future years for which the tax benefit has already been reflected on our Consolidated Statements of Earnings. Deferred tax liabilities generally represent items that have already been taken as a deduction on our tax return but have not yet been recognized as an expense in our Consolidated Statements of Earnings. The effect on deferred tax assets and liabilities due to a change in tax rates is recognized in income tax expense in the period that includes the enactment date.
Our deferred tax assets are reduced by a valuation allowance if, based on the weight of available evidence, it is more likely than not (a likelihood of more than 50 percent) that some portion or all of the deferred tax assets will not be realized. We evaluate the realizability of deferred income tax assets for each of the jurisdictions in which we operate. If we experience cumulative pretax income in a particular jurisdiction in the three-year period including the current and prior two years, we normally conclude that the deferred income tax assets will more likely than not be realizable and no valuation allowance is recognized,
55
unless known or planned operating developments would lead management to conclude otherwise. However, if we experience cumulative pretax losses in a particular jurisdiction in the three-year period including the current and prior two years, we then consider a series of factors in the determination of whether the deferred income tax assets can be realized. These factors include historical operating results, known or planned operating developments, the period of time over which certain temporary differences will reverse, consideration of the utilization of certain deferred income tax liabilities, tax law carryback capability in the particular country, and prudent and feasible tax planning strategies. After evaluation of these factors, if the deferred income tax assets are expected to be realized within the tax carryforward period allowed for that specific country, we would conclude that no valuation allowance would be required. To the extent that the deferred income tax assets exceed the amount that is expected to be realized within the tax carryforward period for a particular jurisdiction, we establish a valuation allowance.
For the year ended December 31, 2025, the Company adopted ASU 2023-09, Improvements to Income Tax Disclosures, on a prospective basis. Refer to Note 11 for additional information.
Accumulated Other Comprehensive Income (Loss)—AOCI refers to certain gains and losses that under U.S. GAAP are included in comprehensive income (loss) but are excluded from net earnings as these amounts are initially recorded as an adjustment to stockholders’ equity. Foreign currency translation adjustments are generally not adjusted for income taxes as they relate to indefinite investments in non-U.S. subsidiaries.
On the Distribution Date, due to certain investments in foreign subsidiaries transferred to Ralliant, the Company de-designated as net investment hedges the outstanding €500 million Euro-denominated senior unsecured notes due 2026, €275 million Euro-denominated term loan, and ¥14.4 billion Yen-denominated term loan. Refer to Note 8 for further detail on the repayments of these debt instruments during the third quarter of 2025. As of December 31, 2025, a portion of the €700 million Euro-denominated senior unsecured notes due 2029 remained designated as a net investment hedge on our investment in applicable foreign operations.
When designated as net investment hedge, the after-tax foreign currency transaction gains and losses on the debt were deferred in the foreign currency translation component of AOCI as an offset to the foreign currency translation adjustments on our investments in foreign subsidiaries. Any amounts deferred in AOCI will remain until the hedged investment is sold or substantially liquidated. Concurrent with the Separation, cumulative net foreign currency transaction losses of $120 million were reclassified from AOCI into retained earnings.
We recognized after-tax foreign currency transaction losses of $161.1 million, gains of $60.4 million, and losses of $1.2 million during the years ended December 31, 2025, 2024, and 2023, respectively, on the debt that was deferred in the foreign currency translation component of AOCI as an offset to the foreign currency translation adjustments on our investments in foreign subsidiaries. We recorded no ineffectiveness from our net investment hedges during the years ended December 31, 2025, 2024, and 2023. During the year ended December 31, 2025, the foreign currency transaction losses associated with Euro-denominated notes not designated as a net investment hedge were immaterial.
56
The changes in AOCI by component are summarized below ($ in millions):
| Foreign currency translation adjustments | Pension & post- retirement plan benefit adjustments (b) | Total | |||||||||||||||
| Balance, December 31, 2022 | $ | ( | $ | ( | $ | ( | |||||||||||
| Other comprehensive income (loss) before reclassifications, net of income taxes | ( | ( | |||||||||||||||
Amounts reclassified from AOCI into income: | |||||||||||||||||
Increase (decrease) | (a) | ||||||||||||||||
| Income tax impact | ( | ( | |||||||||||||||
Amounts reclassified from AOCI into income, net of income taxes: | |||||||||||||||||
| Net current period other comprehensive income (loss): | ( | ( | |||||||||||||||
| Balance, December 31, 2023 | $ | ( | $ | ( | $ | ( | |||||||||||
| Other comprehensive income (loss) before reclassifications, net of income taxes | ( | ( | |||||||||||||||
Amounts reclassified from AOCI into income: | |||||||||||||||||
Increase (decrease) | (a) | ||||||||||||||||
| Income tax impact | ( | ( | |||||||||||||||
Amounts reclassified from AOCI into income, net of income taxes | |||||||||||||||||
| Net current period other comprehensive income (loss) | ( | ( | |||||||||||||||
| Balance, December 31, 2024 | $ | ( | $ | ( | $ | ( | |||||||||||
| Other comprehensive income (loss) before reclassifications, net of income taxes | ( | ||||||||||||||||
Amounts reclassified from AOCI into income: | |||||||||||||||||
Increase (decrease) | (a) | ||||||||||||||||
| Income tax impact | ( | ( | |||||||||||||||
Amounts reclassified from AOCI into income, net of income taxes | |||||||||||||||||
| Net current period other comprehensive income (loss) | |||||||||||||||||
PT Separation (c) | |||||||||||||||||
| Balance, December 31, 2025 | $ | $ | ( | $ | |||||||||||||
(a) This component of AOCI is included in the computation of net periodic pension cost (refer to Note 9). | |||||||||||||||||
(b) Includes balances relating to defined benefit plans, supplemental executive retirement plans, and other postretirement employee benefit plans. | |||||||||||||||||
(c) Reflects the reclassification of cumulative translation adjustments as a result of the PT Separation. Refer to Note 3 for additional details. | |||||||||||||||||
Pension—We measure our pension assets and obligations to determine the funded status as of December 31st each year, and recognize an asset for an overfunded status or a liability for an underfunded status in our Consolidated Balance Sheets. Changes in the funded status of the pension plans are recognized in the year in which the changes occur and are recorded within Other comprehensive income (loss). We record all components of net periodic pension costs, with the exception of service costs, in other non-operating expenses as a component of non-operating income in the accompanying Consolidated Statements of Earnings. Service costs are recorded within Cost of sales and Selling, general and administrative expenses in the Consolidated Statements of Earnings according to the classification of the participant’s compensation. Refer to Note 9 for additional information on our pension plans including a discussion of actuarial assumptions.
57
Recently Issued Accounting Standards
In November 2024, the FASB issued ASU 2024-03, Income Statement - Reporting Comprehensive Income - Expense Disaggregation Disclosures (Subtopic 220-40) — Disaggregation of Income Statement Expenses, which amends the disclosure requirements related to certain costs and expenses on an interim and annual basis. This standard is effective for fiscal year ending December 31, 2027, and interim periods within fiscal year ending December 31, 2028, and can be applied either on a prospective or retrospective basis. The adoption of the standard will not impact our consolidated financial statements. Upon adoption, we will update the applicable interim and annual disclosures to align with the new standard.
In July 2025, the FASB issued ASU 2025-05, Financial Instruments - Credit Losses (Topic 326) — Measurement of Credit Losses for Accounts Receivable and Contract Assets, which provides a practical expedient to measure credit losses on current accounts receivable and current contract assets. The practical expedient allows companies to assume that current conditions as of the balance sheet date do not change for the remaining life of the asset when measuring credit losses. This standard is effective for fiscal year ending December 31, 2026 and interim periods within 2026, with early adoption permitted, and should be applied on a prospective basis. We are not anticipating this standard to have a material impact on our consolidated financial statements.
In September 2025, the FASB issued ASU 2025-06, Intangibles - Goodwill and Other - Internal-Use Software (Subtopic 350-40) — Targeted Improvements to the Accounting for Internal-Use Software, which clarifies and modernizes the software cost capitalization guidance by removing the previous “development stage” model and introducing a more judgment-based approach. This standard is effective for fiscal year ending December 31, 2028, and interim periods within 2028, with early adoption permitted, and may be applied using a prospective, retrospective or modified transition approach. We are currently in the process of evaluating the effects of this standard on our consolidated financial statements.
NOTE 3. DISCONTINUED OPERATIONS
On the Distribution Date, the Company completed the PT Separation by distributing all of the issued and outstanding shares of Ralliant, the entity that was created to hold the corresponding businesses, to Fortive stockholders on a pro rata basis. To effect the Separation, the Company distributed to its stockholders one share of Ralliant common stock for every three shares of Fortive common stock held on June 16, 2025, the record date for the distribution. Fortive stockholders received cash in lieu of any fractional shares of Ralliant common stock that they would have received after application of this ratio.
In preparation for the Separation, on May 15, 2025, Ralliant entered into a credit agreement with a syndicate of banks and on June 27, 2025, borrowed $1.15 billion to fund the $1.15 billion cash dividend Ralliant made to Fortive prior to the Distribution Date (the “Ralliant Dividend”).
The accounting requirements for reporting Ralliant as a discontinued operation were met when the Separation was completed. Accordingly, the accompanying consolidated financial statements for all periods presented reflect this business as a discontinued operation.
In connection with the Separation, the Company incurred $112 million in Separation-related costs during the year ended December 31, 2025, which were recorded within net earnings (loss) from discontinued operations in the Consolidated Condensed Statements of Earnings. These costs were primarily related to professional fees associated with finance, tax, legal, banking and information technology services as well as redundant general and administrative costs.
Fortive and Ralliant entered into various agreements to effect the Separation and to provide a framework for their relationship after the Separation, including a separation and distribution agreement, a transition services agreement, an employee matters agreement, a tax matters agreement, an intellectual property matters agreement, a Fortive Business System (“FBS”) license agreement and a Fort solutions license agreement. These agreements provide for the allocation between Fortive and Ralliant of assets, employees, liabilities and obligations (including investments, property, employee benefits and tax-related assets and liabilities) attributable to periods prior to, at and after the Separation and govern certain relationships between Fortive and Ralliant after the Separation. The amounts paid and received by Fortive for transition services provided under the above agreements, as well as sales and purchases to and from Ralliant, were not material to the Company’s results of operations during the year ended December 31, 2025.
58
The key components of income from discontinued operations for the year ended months ended December 31, 2025 and December 31, 2024 were as follows ($ in millions):
| Year Ended December 31, | |||||||||||||||||
| 2025 | 2024 | 2023 | |||||||||||||||
| Sales | $ | $ | $ | ||||||||||||||
| Cost of sales | ( | ( | ( | ||||||||||||||
| Selling, general and administrative expenses | ( | ( | ( | ||||||||||||||
| Research and development expenses | ( | ( | ( | ||||||||||||||
Gain on sale of property | |||||||||||||||||
Loss from divestiture | ( | ||||||||||||||||
Other expenses | ( | ( | ( | ||||||||||||||
Earnings from discontinued operations before income taxes | |||||||||||||||||
| Income taxes | ( | ( | ( | ||||||||||||||
| Net earnings from discontinued operations | $ | $ | $ | ||||||||||||||
The following table summarizes the major classes of assets and liabilities of discontinued operations that were included in the Company’s Consolidated Condensed Balance Sheets as of December 31, 2024.
($ in millions) | December 31, 2024 | ||||
| ASSETS | |||||
| Accounts receivable, net | $ | ||||
| Inventories | |||||
Prepaid expenses and other current assets | |||||
| Total current assets, discontinued operations | |||||
| Property, plant and equipment, net | |||||
| Other non-current assets | |||||
| Goodwill | |||||
| Other intangible assets, net | |||||
| Total other assets, discontinued operations | |||||
| Total assets, discontinued operations | $ | ||||
| LIABILITIES | |||||
| Trade accounts payable | $ | ||||
| Accrued expenses and other current liabilities | |||||
| Total current liabilities, discontinued operations | |||||
| Other long-term liabilities | |||||
| Total liabilities, discontinued operations | $ | ||||
The assets from discontinued operations as of December 31, 2025 were $20.8 million, which consisted of receivables from Ralliant related to the tax matters agreement and pass through arrangements. During the year ended December 31, 2025, we received cash payments from Ralliant of $135 million as reimbursement for pass through costs paid on Ralliant’s behalf. This activity is recorded within operating cash provided by discontinued operations in the Consolidated Statement of Cash Flows.
Goodwill arises from the purchase price for acquired businesses exceeding the fair value of tangible and intangible assets acquired, less assumed liabilities. We assess the goodwill of each of our reporting units for impairment at least annually as of the first day of the fourth quarter and as “triggering” events occur that indicate that it is more likely than not that an impairment exists. We performed both qualitative and quantitative impairment tests for reporting units, as determined to be appropriate.
We estimate the fair value of our reporting units primarily using a market approach, based on multiples of earnings before interest, taxes, depreciation, and amortization (“EBITDA”) determined by current trading market multiples of earnings for
59
companies operating in businesses similar to each of our reporting units, in addition to recent market available sale transactions of comparable businesses. In certain circumstances we also evaluate other factors including results of the estimated fair value utilizing a discounted cash flow analysis (i.e., an income approach), market positions of the businesses, comparability of market sales transactions, and financial and operating performance in order to validate the results of the market approach. If the estimated fair value of the reporting unit is less than its carrying value, we will impair the goodwill for the amount of the carrying value in excess of the fair value.
We performed goodwill impairment testing for our reporting units, and no
The following is a rollforward of our goodwill by segment ($ in millions):
| Intelligent Operating Solutions | Advanced Healthcare Solutions | Total | |||||||||||||||
| Balance, December 31, 2023 | $ | $ | $ | ||||||||||||||
| Measurement period adjustments for prior year acquisitions | |||||||||||||||||
| Foreign currency translation and other | ( | ( | ( | ||||||||||||||
| Balance, December 31, 2024 | |||||||||||||||||
Attributable to current year acquisitions (a) | |||||||||||||||||
| Foreign currency translation and other | |||||||||||||||||
| Balance, December 31, 2025 | $ | $ | $ | ||||||||||||||
(a) Refer to Note 1 for further detail on the current year acquisitions. | |||||||||||||||||
Finite-lived intangible assets are amortized over the shorter of their legal or estimated useful lives. The following summarizes the gross carrying value and accumulated amortization for each major category of intangible asset as of December 31 ($ in millions):
| 2025 | 2024 | ||||||||||||||||||||||
Gross Carrying Amount (a) | Accumulated Amortization (a) | Gross Carrying Amount | Accumulated Amortization | ||||||||||||||||||||
| Finite-lived intangibles: | |||||||||||||||||||||||
| Patents and technology | $ | $ | ( | $ | $ | ( | |||||||||||||||||
| Customer relationships and other intangibles | ( | ( | |||||||||||||||||||||
| Trademarks and trade names | ( | ( | |||||||||||||||||||||
| Total finite-lived intangibles | ( | ( | |||||||||||||||||||||
| Indefinite-lived intangibles: | |||||||||||||||||||||||
| Trademarks and trade names | — | — | |||||||||||||||||||||
| Total intangibles | $ | $ | ( | $ | $ | ( | |||||||||||||||||
(a) During the year ended December 31, 2025, certain trademarks and trade names were reclassified from indefinite-lived intangible assets to finite-lived intangibles. We performed an impairment test at the time of the reclassification and determined that no impairment had occurred. | |||||||||||||||||||||||
Total intangible amortization expense in 2025, 2024, and 2023 was $368 million, $369 million and $367 million, respectively. Based on the intangible assets recorded as of December 31, 2025, amortization expense is estimated to be $354 million during 2026, $324 million during 2027, $298 million during 2028, $222 million during 2029, and $143 million during 2030.
60
NOTE 5. FAIR VALUE MEASUREMENTS
Accounting standards define fair value based on an exit price model, establish a framework for measuring fair value for assets and liabilities required to be carried at fair value, and provide for certain disclosures related to the valuation methods used within the valuation hierarchy as established within the accounting standards. This hierarchy prioritizes the inputs into three broad levels as follows:
•Level 1 inputs are quoted prices (unadjusted) for identical assets or liabilities in active markets.
•Level 2 inputs are quoted prices for similar assets and liabilities in active markets, quoted prices for identical or similar assets in markets that are not active, or other observable characteristics for the asset or liability, including interest rates, yield curves and credit risks, or inputs that are derived principally from, or corroborated by, observable market data through correlation.
•Level 3 inputs are unobservable inputs based on our assumptions. A financial asset or liability’s classification within the hierarchy is determined based on the lowest level input that is significant to the fair value measurement in its entirety.
Financial assets and liabilities that are measured at fair value on a recurring basis were as follows ($ in millions):
| Quoted Prices in Active Market (Level 1) | Significant Other Observable Inputs (Level 2) | Significant Unobservable Inputs (Level 3) | Total | ||||||||||||||||||||
Deferred compensation liabilities, as of December 31, 2025 | $ | $ | $ | $ | |||||||||||||||||||
Deferred compensation liabilities, as of December 31, 2024 | $ | $ | $ | $ | |||||||||||||||||||
Certain management employees participate in our nonqualified deferred compensation programs that permit such employees to defer a portion of their compensation, on a pretax basis, until after their termination of employment. All amounts deferred under such plans are unfunded, unsecured obligations and are recorded as a component of our compensation and other post-retirement benefits accruals within Other long-term liabilities in the accompanying Consolidated Balance Sheets. Participants may choose among alternative earning rates for the amounts they defer, which are primarily based on investment options within our defined contribution plans for the benefit of U.S. employees (“401(k) Programs”) (except that the earnings rates for amounts contributed unilaterally by the Company are entirely based on changes in the value of Fortive common stock). Changes in the deferred compensation liability under these programs are recognized based on changes in the fair value of the participants’ accounts and are recorded within Selling, general and administrative expenses in the Consolidated Statements of Earnings.
Non-recurring Fair Value Measurements
Certain non-financial and financial assets that are not required to be measured at fair value on a recurring basis and are reported at carrying value. However, these assets are required to be assessed for impairment whenever events or circumstances indicate that their carrying value may not be fully recoverable. Refer to Note 2 for additional information about these assets.
Fair Value of Other Financial Instruments
The carrying amounts and fair values of financial instruments as of December 31 were as follows ($ in millions):
| 2025 | 2024 | ||||||||||||||||||||||
| Carrying Amount | Fair Value | Carrying Amount | Fair Value | ||||||||||||||||||||
| Current portion of long-term debt | $ | $ | $ | $ | |||||||||||||||||||
| Long-term debt, net of current maturities | |||||||||||||||||||||||
As of December 31, 2025 and 2024, the current portion of long-term debt and long-term debt, net of current maturities were categorized as Level 1.
The fair value of the long-term borrowings were based on quoted market prices. The difference between the fair value and the carrying amounts of long-term borrowings may be attributable to changes in market interest rates and/or our credit ratings subsequent to the borrowing. The fair value of cash and equivalents, trade accounts receivable, net, trade accounts payable, and commercial paper approximates their carrying amount due to the short-term maturities of these instruments.
Refer to Note 9 for information related to the fair value of the assets related to the significant Company-sponsored noncontributory defined benefit pension plans.
61
NOTE 6. ACCRUED EXPENSES AND OTHER LIABILITIES
Accrued expenses and other liabilities as of December 31 were as follows ($ in millions):
| 2025 | 2024 | ||||||||||||||||||||||
| Current | Long-term | Current | Long-term | ||||||||||||||||||||
| Deferred revenue | $ | $ | $ | $ | |||||||||||||||||||
| Compensation and other post-retirement benefits | |||||||||||||||||||||||
| Taxes, income and other | |||||||||||||||||||||||
| Pension obligations | |||||||||||||||||||||||
| Other | |||||||||||||||||||||||
| Total | $ | $ | $ | $ | |||||||||||||||||||
NOTE 7. LEASES
We determine if an arrangement is or contains a lease at inception and recognize a right-of-use (“ROU”) asset and a lease liability for all leases with terms greater than 12 months. We have operating leases for office space, warehouses, distribution centers, research and development facilities, manufacturing locations, and certain equipment, primarily automobiles. Many leases include optional terms, ranging from options to terminate the lease in less than one year to options to extend the lease for up to 15 years. We include optional periods as part of the lease term when we determine that we are reasonably certain to exercise the renewal option or we will not early terminate the lease. Reasonably certain is based on economic incentives and represents a high threshold. We have lease agreements with lease and non-lease components, and we have elected the practical expedient for all underlying asset classes to account for the lease and related non-lease component(s) as a single lease component.
Supplemental information related to operating leases for each period is presented as follows ($ in millions):
As of December 31, | |||||||||||
| 2025 | 2024 | ||||||||||
| $ | $ | ||||||||||
Operating lease liabilities (b) | |||||||||||
(a) ROU assets are recorded in the Consolidated Condensed Balance Sheets within Other assets. | |||||||||||
(b) Operating lease liabilities are recorded in the Consolidated Condensed Balance Sheets within Accrued expenses and other current liabilities, and Other long-term liabilities. | |||||||||||
| Year Ended December 31, | |||||||||||||||||
| 2025 | 2024 | 2023 | |||||||||||||||
| Operating lease costs | $ | $ | $ | ||||||||||||||
Cash paid for operating leases | $ | $ | $ | ||||||||||||||
ROU assets obtained in exchange for operating lease obligations | |||||||||||||||||
62
The following table presents the maturities of our operating lease liabilities as of December 31, 2025 ($ in millions):
| 2026 | $ | ||||
| 2027 | |||||
| 2028 | |||||
| 2029 | |||||
| 2030 | |||||
| Thereafter | |||||
| Total lease payments | |||||
| Less: imputed interest | ( | ||||
| Total operating lease liabilities | $ | ||||
As of December 31, 2025 and 2024, the weighted average lease term of our operating leases were both approximately 7 3.1 % and 3.2 %, respectively. We primarily use our incremental borrowing rate as the discount rate for our operating leases, as we are generally unable to determine the interest rate implicit in the lease.
NOTE 8. FINANCING
The components of our debt as of December 31 were as follows ($ in millions):
| 2025 | 2024 | ||||||||||
| U.S. dollar-denominated commercial paper | $ | $ | |||||||||
| Euro Term Loan due 2025 | |||||||||||
| Yen Term Loan due 2025 | |||||||||||
| Long-term debt, principal amounts | |||||||||||
| Less: aggregate unamortized debt discounts, premiums, and issuance costs | |||||||||||
| Long-term debt, carrying value | |||||||||||
Less: current portion of long-term debt, carrying value | |||||||||||
| Long-term debt, net of current maturities | $ | $ | |||||||||
Commercial Paper Programs
We generally satisfy any short-term liquidity needs that are not met through operating cash flows and available cash primarily through issuances of commercial paper under our U.S. dollar and Euro-denominated commercial paper programs (“Commercial Paper Programs”). Under these programs, we may issue unsecured promissory notes with maturities not exceeding 397 and 183 days, respectively. Proceeds from borrowings under the commercial paper programs are typically available for general corporate purposes, including acquisitions.
Interest expense on commercial paper is paid at maturity and is generally based on our credit ratings at the time of issuance and prevailing short-term interest rates.
Credit support for our Commercial Paper Programs is provided by a five-year $2.0 billion senior unsecured revolving credit facility that expires on October 18, 2027 (the “Revolving Credit Facility”) which, to the extent not otherwise providing credit support for our Commercial Paper Programs, can also be used for working capital and other general corporate purposes. As of December 31, 2025, no borrowings were outstanding under the Revolving Credit Facility. Refer to the section below for further discussion on the Revolving Credit Facility.
63
The details of our Commercial Paper Programs as of December 31, 2025 were as follows ($ in millions):
Carrying value (a) | Weighted average annual effective rate | Weighted average maturity (in days) | |||||||||||||||
| U.S. dollar-denominated commercial paper | $ | % | |||||||||||||||
(a) Net of unamortized debt discount. | |||||||||||||||||
The availability of the Revolving Credit Facility as a standby liquidity facility to repay maturing commercial paper is an important factor in maintaining the Commercial Paper Programs’ credit ratings. We expect to limit any future borrowings under the Revolving Credit Facility to amounts that would leave sufficient credit available under the facility to allow us to borrow, if needed, to repay any outstanding commercial paper as it matures.
We classified our borrowings outstanding under the Commercial Paper Programs as of December 31, 2025 as Long-term debt in the accompanying Consolidated Balance Sheets as we have the intent and ability, as supported by availability under the Revolving Credit Facility, to refinance these borrowings for at least one year from the balance sheet date.
Credit Facilities
Revolving Credit Facility
We have a five-year $2.0 billion Revolving Credit Facility that was last amended on October 18, 2022 (the “Amended and Restated Credit Agreement”), which extended the availability period of the Revolving Credit Facility to October 18, 2027 with an additional two one year extension options at our request and with the consent of the lenders. The Amended and Restated Credit Agreement also contains an option permitting us to request an increase in the amounts available under the Revolving Credit Facility of up to an aggregate additional $1.0 billion.
We are obligated to pay an annual facility fee for the Revolving Credit Facility of between 6.5 and 15 basis points varying according to our long-term debt credit rating. Borrowings under the new Revolving Credit Facility in U.S Dollars bear interest at a rate equal, at our option, to either (1) Term Secured Overnight Financing Rate (“Term SOFR”), plus a 10 basis points Credit Spread Adjustment (“CSA”) plus a margin of between 68.5 and 110.0 basis points, depending on our long-term debt credit rating or (2) the highest of (a) the Federal funds rate plus 50 basis points, (b) the prime rate, (c) Term SOFR plus 100 basis points and (d) 1.0 %, plus in each case a margin between zero and 10 basis points depending on our long-term debt credit rating.
In addition, performance relative to our annual greenhouse gas reduction targets, the interest rate on any borrowings can increase or decrease by 4.0 basis points and the facility fee can increase or decrease by 1.0 basis points, for a maximum impact of an increase or decrease of 5.0 basis points.
The Amended and Restated Credit Agreement requires us to maintain a consolidated net leverage ratio of debt to consolidated EBITDA (as defined in the Credit Agreement) of less than 3.5 to 1.0. The maximum consolidated net leverage ratio will be increased to 4.0 to 1.0 for the four consecutive full fiscal quarters immediately following the consummation of any acquisition by us in which the purchase price exceeds $250 million. The Amended and Restated Credit Agreement also contains customary representations, warranties, conditions precedent, events of default, indemnities, and affirmative and negative covenants.
Euro-denominated Senior Unsecured Notes Due 2026 and 2029
On February 13, 2024, we completed the registered offering of the following Euro-denominated senior unsecured notes:
•€500 million in aggregate principal amount of our 3.7 % Euro-denominated senior unsecured notes due 2026 (the “2026 Notes”) issued at 99.928 % of their principal amount and bearing interest at 3.7 % per annum. The 2026 Notes mature on February 13, 2026 with interest payable in arrears on February 13 of each year, beginning in 2025.
•€700 million in aggregate principal amount of our 3.7 % Euro-denominated senior unsecured notes due 2029 (the “2029 Notes”) issued at 99.943 % of their principal amount and bearing interest at 3.7 % per annum. The 2029 Notes mature on August 15, 2029 with interest payable in arrears on August 15 of each year, beginning in 2024.
The net proceeds from the offering, after underwriting discounts and commissions and offering expenses, were approximately $1.3 billion based on the currency exchange rates at which the Euro denominated proceeds were converted into U.S. dollars.
64
We used the net proceeds to refinance the $1.0 billion outstanding principal of the Delayed-Draw Term Loan Due 2024, refinance borrowings under the U.S. dollar-denominated commercial paper, and for general corporate purposes.
Redemption Provisions and Covenants Applicable to 2026 and 2029 Notes
Prior to July 15, 2029 for the 2029 Notes, and prior to maturity for the 2026 Notes, we may redeem the applicable series of notes at our option, in whole or in part, at any time and from time to time, at the applicable make-whole redemption price specified in the indentures. On or after July 15, 2029, we may redeem the 2029 Notes, in whole or in part, at any time and from time to time, at a redemption price equal to 100 % of the principal amount of the 2029 Notes being redeemed plus accrued and unpaid interest thereon to, but not including, the redemption date.
We may, at our option, redeem the applicable series of notes, in whole but not in part, at a redemption price equal to 100 % of the principal amount of such series of notes to be redeemed, together with any accrued and unpaid interest thereon to, but not including, the redemption date, at any time, if as a result of any change in, or amendment to, the laws, regulations, treaties, or rulings of the United States or any political subdivision of or in the United States or any taxing authority thereof or therein affecting taxation, or any change in, or amendment to, the application, official interpretation, administration or enforcement of such laws, regulations, treaties or rulings (including a holding by a court of competent jurisdiction in the United States), which change or amendment is enacted, adopted, announced or become effective, we become or, based upon a written opinion of independent counsel selected by us, will become obligated to pay additional amounts with respect to the applicable series of notes.
If a change of control triggering event occurs, we will, in certain circumstances, be required to make an offer to repurchase the notes from each holder at a purchase price equal to 101 % of the principal amount of the notes being repurchased, plus accrued and unpaid interest to, but not including the repurchase date. A change of control triggering event is defined as the occurrence of both a change of control and a rating event, each as defined in the indentures. Except in connection with a change of control triggering event, the 2026 Notes and 2029 Notes do not have any credit rating downgrade triggers that would accelerate the maturity of the notes. The 2026 Notes and 2029 Notes contain customary covenants, and none of these covenants are considered restrictive to our operations.
During the third quarter of 2025, Fortive used approximately $302 million of the Ralliant Dividend to redeem €252 million of the outstanding principal of the 2026 Notes, and the accrued interest thereon, with €248 million, or approximately $291 million remaining outstanding following such redemption.
Financing Transactions Subsequent to December 31, 2025
During February 2026, we refinanced €248 million of the outstanding principal on the 2026 Notes and accrued interest thereon, primarily using the proceeds from the commercial paper issued under the U.S. dollar and Euro-denominated commercial paper programs during the first quarter of 2026.
Registered Notes
As of December 31, 2025, we had outstanding the following senior notes, collectively the “Registered Notes”:
•$900 million aggregate principal amount of senior notes due June 15, 2026 issued at 99.644 % of their principal amount and bearing interest at the rate of 3.15 % per year.
•$350 million and $200 million aggregate principal amounts of senior notes due June 15, 2046 issued at 99.783 % and 101.564 %, respectively, of their principal amounts and bearing interest at the rate of 4.30 % per year.
Interest on the Registered Notes is payable semi-annually in arrears on June 15 and December 15 of each year.
Covenants and Redemption Provisions Applicable to Registered Notes
We may redeem the Registered Notes of the applicable series, in whole or in part, at any time prior to the dates specified in the Registered Notes indenture (the “Call Dates”) by paying the principal amount and the “make-whole” premium specified in the Registered Notes indenture, plus accrued and unpaid interest. Additionally, we may redeem all or any part of the Registered Notes of the applicable series on or after the Call Dates without paying the “make-whole” premium specified in the Registered Notes indenture. We may redeem the 3.15 % senior unsecured notes due 2026 and the 4.30 % senior unsecured notes due 2046 on or after March 15, 2026 and December 15, 2045, respectively.
If a change of control triggering event occurs, we will, in certain circumstances, be required to make an offer to repurchase the Registered Notes at a purchase price equal to 101 % of the principal amount, plus accrued and unpaid interest. A change of
65
control triggering event is defined as the occurrence of both a change of control and a rating event, each as defined in the Registered Notes indenture. Except in connection with a change of control triggering event, the Registered Notes do not have any credit rating downgrade triggers that would accelerate the maturity of the Registered Notes.
The Registered Notes contain customary covenants, including limits on the incurrence of certain secured debt and sale/leaseback transactions.
None of the covenants from the Amended and Restated Credit Agreement, the 2026 and 2029 Notes, and the Registered Notes are considered restrictive to our operations and as of December 31, 2025, and we were in compliance with all of our covenants.
Euro and Yen Term Loan
In 2022, we entered into and drew down on a €275 million and a ¥14.4 billion senior unsecured term facility (“Euro Term Loan” and “Yen Term Loan”, respectively). During the third quarter of 2025, Fortive used $324 million and $98 million of the Ralliant Dividend to repay the outstanding principle of the Euro Term Loan and Yen Term Loan, and accrued interest thereon.
Delayed-Draw Term Loan due 2024
In 2023 and 2024, we drew down $550 million and $450 million under a delayed-draw senior unsecured term facility (“Delayed-Draw Term Loan Due 2024”), respectively. On February 13, 2024, we used the net proceeds from the 2026 Notes and 2029 Notes to refinance the entire $1.0 billion outstanding principal and accrued interest thereon.
The Company’s future minimum principal payments due are presented in the following table:
| 2026 | $ | ||||
| 2027 | |||||
| 2028 | |||||
| 2029 | |||||
| 2030 | |||||
| Thereafter | |||||
Total principal payments (a) | $ | ||||
(a) The table above does not include principal balance of $ | |||||
We made interest payments of $145 million, $136 million, and $131 million during the years ended December 31, 2025, 2024 and 2023, respectively.
NOTE 9. RETIREMENT BENEFIT PLANS
Certain employees participate in noncontributory defined benefit pension plans. In general, our policy is to fund these plans based on considerations relating to legal requirements, underlying asset returns, the plan’s funded status, the anticipated deductibility of the contribution, local practices, market conditions, interest rates, and other factors. Our U.S. pension plans are frozen, and as such, there are no ongoing benefit accruals associated with the U.S. pension plans. The following describes our significant pension plans as of December 31, 2025 and 2024.
66
The following sets forth the funded status of our plans and amounts recorded in Accumulated other comprehensive income (loss) as of the most recent actuarial valuations using measurement dates of December 31 ($ in millions):
| U.S. Pension Benefits | Non-U.S. Pension Benefits | ||||||||||||||||||||||
| 2025 | 2024 | 2025 | 2024 | ||||||||||||||||||||
| Change in pension benefit obligation: | |||||||||||||||||||||||
| Benefit obligation at beginning of year | $ | $ | $ | $ | |||||||||||||||||||
| Service cost | |||||||||||||||||||||||
| Interest cost | |||||||||||||||||||||||
| Employee contributions | |||||||||||||||||||||||
| Benefits paid and other plan costs | ( | ( | ( | ( | |||||||||||||||||||
| Actuarial loss (gain) | ( | ( | |||||||||||||||||||||
| Amendments, settlements and curtailments | ( | ( | |||||||||||||||||||||
| Plan acquisitions and other | ( | ||||||||||||||||||||||
| Foreign exchange rate impact | ( | ||||||||||||||||||||||
| Benefit obligation at end of year | |||||||||||||||||||||||
| Change in plan assets: | |||||||||||||||||||||||
| Fair value of plan assets at beginning of year | |||||||||||||||||||||||
| Actual return on plan assets | ( | ||||||||||||||||||||||
| Employer contributions | |||||||||||||||||||||||
| Employee contributions | |||||||||||||||||||||||
| Amendments and settlements | ( | ( | |||||||||||||||||||||
| Benefits paid and other plan costs | ( | ( | ( | ( | |||||||||||||||||||
| Plan acquisitions and other | ( | ||||||||||||||||||||||
| Foreign exchange rate impact | ( | ||||||||||||||||||||||
| Fair value of plan assets at end of year | |||||||||||||||||||||||
| Funded status | $ | $ | ( | $ | ( | $ | ( | ||||||||||||||||
The difference between the accumulated benefit obligation and the projected benefit obligation as of December 31, 2025 and 2024 is immaterial.
| U.S. Pension Benefits | Non-U.S. Pension Benefits | ||||||||||||||||||||||
| 2025 | 2024 | 2025 | 2024 | ||||||||||||||||||||
| Amounts recorded in the Consolidated Balance Sheets as of December 31 | |||||||||||||||||||||||
| Other assets | $ | $ | $ | $ | |||||||||||||||||||
| Accrued expenses and other current liabilities | ( | ( | ( | ( | |||||||||||||||||||
| Other long-term liabilities | ( | ( | ( | ( | |||||||||||||||||||
| Net amount | $ | $ | ( | $ | ( | $ | ( | ||||||||||||||||
| U.S. Pension Benefits | Non-U.S. Pension Benefits | ||||||||||||||||||||||
| 2025 | 2024 | 2025 | 2024 | ||||||||||||||||||||
| Amounts recorded in AOCI as of December 31 | |||||||||||||||||||||||
| Prior service cost | $ | $ | $ | $ | |||||||||||||||||||
| Net gain (loss) | ( | ( | |||||||||||||||||||||
| Total pre-tax amount | $ | $ | $ | ( | $ | ( | |||||||||||||||||
67
Components of net periodic pension cost
The following sets forth the components of net periodic pension cost for our plans for the years ended December 31 ($ in millions):
| U.S. Pension Benefits | Non-U.S. Pension Benefits | ||||||||||||||||||||||||||||||||||
| 2025 | 2024 | 2023 | 2025 | 2024 | 2023 | ||||||||||||||||||||||||||||||
| Service cost | $ | $ | $ | $ | $ | $ | |||||||||||||||||||||||||||||
| Interest cost | |||||||||||||||||||||||||||||||||||
| Expected return on plan assets | ( | ( | ( | ( | ( | ( | |||||||||||||||||||||||||||||
| Amortization of net loss | |||||||||||||||||||||||||||||||||||
| Amortization of prior service cost | |||||||||||||||||||||||||||||||||||
| Net curtailment and settlement loss recognized | ( | ( | ( | ||||||||||||||||||||||||||||||||
| Net periodic pension cost | $ | $ | ( | $ | $ | $ | $ | ||||||||||||||||||||||||||||
Weighted average assumptions used to determine benefit obligations at date of measurement
| U.S. Pension Plans | Non-U.S. Pension Plans | ||||||||||||||||||||||
| 2025 | 2024 | 2025 | 2024 | ||||||||||||||||||||
| Discount rate | % | % | % | % | |||||||||||||||||||
Rate of compensation increase (a) | N/A | N/A | % | % | |||||||||||||||||||
(a) The frozen U.S. pension plans do not use the rate of compensation increase as an input in determining the benefit obligations at date of measurement. | |||||||||||||||||||||||
Weighted average assumptions used to determine net periodic pension cost at date of measurement
| U.S. Pension Plans | Non-U.S. Pension Plans | ||||||||||||||||||||||||||||||||||
| 2025 | 2024 | 2023 | 2025 | 2024 | 2023 | ||||||||||||||||||||||||||||||
| Discount rate | % | % | % | % | % | % | |||||||||||||||||||||||||||||
| Expected return on plan assets | % | % | % | % | % | % | |||||||||||||||||||||||||||||
Rate of compensation increase (a) | N/A | N/A | N/A | % | % | % | |||||||||||||||||||||||||||||
(a) The frozen U.S. pension plans do not use the rate of compensation increase as an input in determining the net periodic pension cost at date of measurement. | |||||||||||||||||||||||||||||||||||
The discount rates reflect the market rate on December 31 for high-quality fixed-income investments with maturities corresponding to our benefit obligations and are subject to change each year. Rates appropriate for each plan are determined based on investment grade instruments with maturities approximately equal to the average expected benefit payout under the plan.
The expected rates of return reflect the asset allocation of the plans and ranged from 2.0 % to 5.9 % in 2025, and 1.8 6.5
Plan Assets
Plan assets are invested in various mutual funds, insurance contracts, and other private investments as determined by the administrator of each plan. Certain mutual funds and other private investments, are valued using the net asset value (“NAV”) method as a practical expedient. The investments valued using the NAV method are allocated across a broad array of funds and diversify the portfolio. The value of the plan assets directly affects the funded status of our pension plans recorded in the financial statements.
68
The fair values of our pension plan assets as of December 31, 2025, by asset category were as follows ($ in millions):
| Quoted Prices in Active Market (Level 1) | Significant Other Observable Inputs (Level 2) | Significant Unobservable Inputs (Level 3) | Total | ||||||||||||||||||||
| Cash and equivalents | $ | $ | $ | $ | |||||||||||||||||||
| Mutual funds | |||||||||||||||||||||||
| Insurance contracts | |||||||||||||||||||||||
| Total | $ | $ | $ | $ | |||||||||||||||||||
Investments measured at NAV(a): | |||||||||||||||||||||||
| Mutual funds | |||||||||||||||||||||||
| Other private investments | |||||||||||||||||||||||
| Total assets at fair value | $ | ||||||||||||||||||||||
(a) The fair value amounts presented in the table above are intended to permit reconciliation of the fair value hierarchy to the total fair value of plan assets. | |||||||||||||||||||||||
The fair values of our pension plan assets as of December 31, 2024, by asset category were as follows ($ in millions):
| Quoted Prices in Active Market (Level 1) | Significant Other Observable Inputs (Level 2) | Significant Unobservable Inputs (Level 3) | Total | ||||||||||||||||||||
| Cash and equivalents | $ | $ | $ | $ | |||||||||||||||||||
| Mutual funds | |||||||||||||||||||||||
| Insurance contracts | |||||||||||||||||||||||
| Total | $ | $ | $ | $ | |||||||||||||||||||
Investments measured at NAV(a): | |||||||||||||||||||||||
| Mutual funds | |||||||||||||||||||||||
| Other private investments | |||||||||||||||||||||||
| Total assets at fair value | $ | ||||||||||||||||||||||
(a) The fair value amounts presented in the table above are intended to permit reconciliation of the fair value hierarchy to the total fair value of plan assets. | |||||||||||||||||||||||
Certain mutual funds are valued at the quoted closing price reported on the active market on which the individual securities are traded. Common stock, corporate bonds, and mutual funds that are not traded on an active market are valued at quoted prices reported by investment brokers and dealers based on the underlying terms of the security and comparison to similar securities traded on an active market.
Certain mutual funds and other private investments are valued using NAV based on the information provided by the asset fund managers, which reflects the plan’s share of the fair value of the net assets of the investment.
69
Expected Contributions
During 2025, we contributed $0.4 million and $4 million to our U.S. and non-U.S. defined benefit pension plans, respectively. During 2026, our cash contribution requirements for our U.S. and non-U.S. defined benefit pension plans are expected to be approximately $0.4 million and $4 million, respectively.
The following sets forth benefit payments to participants, which reflect expected future service, as appropriate, expected to be paid by the plans in the periods indicated ($ in millions):
| U.S. Pension Plans | Non-U.S. Pension Plans | All Pension Plans | |||||||||||||||
| 2026 | $ | $ | $ | ||||||||||||||
| 2027 | |||||||||||||||||
| 2028 | |||||||||||||||||
| 2029 | |||||||||||||||||
| 2030 | |||||||||||||||||
| 2031-2035 | |||||||||||||||||
Defined Contribution Plans
We administer and maintain 401(k) programs with contributions determined based on a percentage of compensation. We recognized compensation expense totaling $40 million in 2025, $41 million in 2024, and $39 million in 2023.
NOTE 10. SALES
We derive revenue primarily from the sales of products, including software, and services. Revenue is recognized when control of promised products or services is transferred to customers in an amount that reflects the consideration we expect to be entitled to in exchange for those products, software, or services.
Contract Assets — In certain circumstances, we record contract assets which include unbilled amounts typically resulting from sales under contracts when revenue recognized exceeds the amount billed to the customer, and right to payment is not only subject to the passage of time. Contract assets were $151 million as of December 31, 2025 and $116 million as of December 31, 2024. Contract assets are primarily recorded within Prepaid expenses and other current assets and Other assets in our Consolidated Balance Sheets.
Contract Costs — We incur and capitalize incremental costs to obtain certain contracts, typically sales-related commissions where the amortization period is greater than one year , and costs associated with assets used by our customers in certain service arrangements. As of December 31, 2025 and 2024, we had $75 million and $59 million, respectively, in net revenue-related contract cost assets primarily related to certain software contracts. Revenue-related contract costs are recorded within Other assets in our Consolidated Balance Sheets. These assets are amortized over the period of benefit, which it is typically between and five years . For incremental costs to obtain contracts with a duration of one year or less, we apply the practical expedient to expense such costs as incurred.
Our contract liabilities as of December 31 consisted of the following ($ in millions):
| 2025 | 2024 | ||||||||||
| Deferred revenue - current | $ | $ | |||||||||
| Deferred revenue - noncurrent | |||||||||||
| Total contract liabilities | $ | $ | |||||||||
In the year ended December 31, 2025, we recognized $390 million of revenue related to our contract liabilities at January 1, 2025. The change in our contract liabilities from December 31, 2024 to December 31, 2025 was primarily due to the timing of billings and recognition of revenue related to subscription-based software contracts, PCS, and extended warranty services.
70
Remaining Performance Obligations — Our remaining performance obligations represent the transaction price of firm, non-cancelable orders and the average contract value for software contracts, for which work has not been performed. We have excluded performance obligations with an original expected duration of one year or less from the amounts below.
The aggregate remaining performance obligations attributable to each of our segments as of December 31, 2025 is as follows ($ in millions):
| 2025 | |||||
| Intelligent Operating Solutions | $ | ||||
| Advanced Healthcare Solutions | |||||
| Total remaining performance obligations | $ | ||||
The majority of remaining performance obligations are related to subscription-based software contracts, and service and support contracts, which we expect to fulfill approximately 75 percent within the next two years , approximately 90 percent within the next three years , and substantially all within four years .
Disaggregation of Revenue
We disaggregate revenue from contracts with customers by sales of product and software and services, geographic location, and end market for each of our segments, as we believe it best depicts how the nature, amount, timing, and uncertainty of our revenue and cash flows are affected by economic factors.
Disaggregation of revenue for the year ended December 31, 2025 is presented as follows ($ in millions):
| Total | Intelligent Operating Solutions | Advanced Healthcare Solutions | |||||||||||||||
| Sales: | |||||||||||||||||
| Sales of products and software | $ | $ | $ | ||||||||||||||
| Sales of services | |||||||||||||||||
| Total | $ | $ | $ | ||||||||||||||
| Geographic: | |||||||||||||||||
North America (a) | $ | $ | $ | ||||||||||||||
Asia-Pacific | |||||||||||||||||
Europe, Middle East, and Africa | |||||||||||||||||
Latin America | |||||||||||||||||
Total | $ | $ | $ | ||||||||||||||
End markets: | |||||||||||||||||
| Healthcare | $ | $ | $ | ||||||||||||||
| Industrial & Manufacturing | |||||||||||||||||
| Energy & Infrastructure | |||||||||||||||||
| Government | |||||||||||||||||
| Retail | |||||||||||||||||
| Other | |||||||||||||||||
| Total | $ | $ | $ | ||||||||||||||
(a) North America is comprised of the United States and Canada. Sales attributed to the United States were | |||||||||||||||||
71
Disaggregation of revenue for the year ended December 31, 2024 is presented as follows ($ in millions):
| Total | Intelligent Operating Solutions | Advanced Healthcare Solutions | |||||||||||||||
| Sales: | |||||||||||||||||
| Sales of products and software | $ | $ | $ | ||||||||||||||
| Sales of services | |||||||||||||||||
| Total | $ | $ | $ | ||||||||||||||
| Geographic: | |||||||||||||||||
North America (a) | $ | $ | $ | ||||||||||||||
Asia-Pacific | |||||||||||||||||
Europe, Middle East, and Africa | |||||||||||||||||
Latin America | |||||||||||||||||
Total | $ | $ | $ | ||||||||||||||
End markets: | |||||||||||||||||
| Healthcare | $ | $ | $ | ||||||||||||||
| Industrial & Manufacturing | |||||||||||||||||
| Energy & Infrastructure | |||||||||||||||||
| Government | |||||||||||||||||
| Retail | |||||||||||||||||
| Other | |||||||||||||||||
| Total | $ | $ | $ | ||||||||||||||
(a) North America is comprised of the United States and Canada. Sales attributed to the United States were | |||||||||||||||||
Disaggregation of revenue for the year ended December 31, 2023 is presented as follows ($ in millions):
| Total | Intelligent Operating Solutions | Advanced Healthcare Solutions | |||||||||||||||
| Sales: | |||||||||||||||||
| Sales of products and software | $ | $ | $ | ||||||||||||||
| Sales of services | |||||||||||||||||
| Total | $ | $ | $ | ||||||||||||||
| Geographic: | |||||||||||||||||
North America (a) | $ | $ | $ | ||||||||||||||
Asia-Pacific | |||||||||||||||||
Europe, Middle East, and Africa | |||||||||||||||||
Latin America | |||||||||||||||||
Total | $ | $ | $ | ||||||||||||||
End markets: | |||||||||||||||||
| Healthcare | $ | $ | $ | ||||||||||||||
| Industrial & Manufacturing | |||||||||||||||||
| Energy & Infrastructure | |||||||||||||||||
| Government | |||||||||||||||||
| Retail | |||||||||||||||||
| Other | |||||||||||||||||
| Total | $ | $ | $ | ||||||||||||||
(a) North America is comprised of the United States and Canada. Sales attributed to the United States were | |||||||||||||||||
72
NOTE 11. INCOME TAXES
Earnings and Income Taxes
Earnings from continuing operations before income taxes for the years ended December 31 were as follows ($ in millions):
| 2025 | 2024 | 2023 | |||||||||||||||
| United States | $ | $ | $ | ||||||||||||||
| International | |||||||||||||||||
| Total | $ | $ | $ | ||||||||||||||
The continuing operations provision for income taxes for the years ended December 31 were as follows ($ in millions):
| 2025 | 2024 | 2023 | |||||||||||||||
| Current: | |||||||||||||||||
| Federal U.S. | $ | $ | $ | ||||||||||||||
| Non-U.S. | |||||||||||||||||
| State and local | |||||||||||||||||
| Deferred: | |||||||||||||||||
| Federal U.S. | ( | ( | ( | ||||||||||||||
| Non-U.S. | ( | ( | |||||||||||||||
| State and local | ( | ( | ( | ||||||||||||||
Total: | |||||||||||||||||
| Federal U.S. | ( | ( | |||||||||||||||
| Non-U.S. | |||||||||||||||||
| State and local | ( | ||||||||||||||||
Total income tax provision | $ | $ | $ | ||||||||||||||
73
Effective Income Tax Rate
The continuing operations effective income tax rate for the year ended December 31, 2025 varies from the U.S. statutory federal income tax rate as follows, in both dollar amounts (in millions) and as a percentage of earnings from continuing operations before income taxes:
2025 | |||||||||||
Amount | Percent (b) | ||||||||||
| Statutory federal income tax rate | $ | % | |||||||||
| Increase (decrease) in tax rate resulting from: | |||||||||||
State income taxes (net of federal income tax benefit) (a) | % | ||||||||||
Foreign tax effects | |||||||||||
| Malta | |||||||||||
Nontaxable interest | ( | ( | % | ||||||||
| Other | % | ||||||||||
Other foreign jurisdictions | % | ||||||||||
Effect of change in tax laws or rates enacted in the current period (b) | ( | % | |||||||||
| Effect of cross-border tax laws | |||||||||||
| Foreign-derived intangible income | ( | ( | % | ||||||||
| Other | % | ||||||||||
| Tax Credits | |||||||||||
| Research and development tax credits | ( | ( | % | ||||||||
| Other | ( | ( | % | ||||||||
| Nontaxable or nondeductible items | % | ||||||||||
Changes in unrecognized tax benefits | ( | ( | % | ||||||||
Other adjustments | ( | % | |||||||||
Effective income tax rate | $ | % | |||||||||
(a) For the year ended December 31, 2025, state taxes in California, Illinois, New Jersey, New York, Texas, and Massachusetts made up the majority (greater than 50%) of the tax effect in this category. | |||||||||||
(b) The sum of the components of effective income tax rate may not equal due to rounding. | |||||||||||
The continuing operations effective income tax rate for the years ended December 31, 2024 and 2023 varies from the U.S. statutory federal income tax rate as follows:
| Percentage of Pretax Earnings | |||||||||||
| 2024 | 2023 | ||||||||||
| Statutory federal income tax rate | % | % | |||||||||
| Increase (decrease) in tax rate resulting from: | |||||||||||
| State income taxes (net of federal income tax benefit) | ( | % | % | ||||||||
| Foreign income taxed at different rates than U.S. statutory rate | ( | % | ( | % | |||||||
| U.S. federal permanent differences related to the TCJA | ( | % | ( | % | |||||||
| Effect of change in tax rates enacted in the current period | ( | % | ( | % | |||||||
| Changes in valuation allowances | ( | % | % | ||||||||
Uncertain tax positions | ( | % | ( | % | |||||||
| Other | % | % | |||||||||
Effective income tax rate | % | % | |||||||||
74
Income tax payments, net of refunds received, related to continuing operations during the year ended December 31, 2025 were as follows ($ in millions):
| 2025 | |||||
| Federal | $ | ||||
| State and local | |||||
| United States | |||||
| China | |||||
Germany | |||||
| Other | |||||
| International | |||||
| Total | $ | ||||
We made income tax payments, net of refunds received, of $114 million, and $122 million during the years ended December 31, 2024 and 2023, respectively.
Deferred Tax Assets and Liabilities
All deferred tax assets and liabilities have been classified as noncurrent and are included in Other assets and Other long-term liabilities in the Consolidated Balance Sheets. Deferred income tax assets and liabilities from continuing operations as of December 31 were as follows ($ in millions):
| 2025 | 2024 | ||||||||||
| Deferred Tax Assets: | |||||||||||
| Operating lease liabilities | $ | $ | |||||||||
| Inventories | |||||||||||
| Pension benefits | |||||||||||
| Stock-based compensation expense | |||||||||||
| Capitalized expenses | |||||||||||
| Tax credit and loss carryforwards | |||||||||||
| Accruals, prepayments, and other | |||||||||||
| Valuation allowances | ( | ( | |||||||||
| Total deferred tax assets | $ | $ | |||||||||
| Deferred Tax Liabilities: | |||||||||||
| Property, plant and equipment | $ | ( | $ | ( | |||||||
| Operating lease right-of-use assets | ( | ( | |||||||||
| Insurance, including self-insurance | ( | ( | |||||||||
| Goodwill, other intangibles, and other | ( | ( | |||||||||
| Total deferred tax liabilities | ( | ( | |||||||||
| Net deferred tax liability | $ | ( | $ | ( | |||||||
In accordance with GAAP, deferred tax assets and liabilities are determined based on the difference between the financial statement and tax basis of assets and liabilities using enacted rates expected to be in effect during the year in which the differences reverse. Deferred tax assets generally represent items that can be used as a tax deduction or credit in our tax return in future years for which the tax benefit has already been reflected in our Consolidated Statements of Earnings. Deferred tax liabilities generally represent items that have already been taken as a deduction on our tax return but have not yet been recognized as an expense in our Consolidated Statements of Earnings. The effect on deferred tax assets and liabilities due to a change in tax rates is recognized in income tax expense in the period that includes the enactment date.
Our deferred tax assets are reduced by a valuation allowance if, based on the weight of available evidence, it is more likely than not (a likelihood of more than 50 percent) that some portion or all of the deferred tax assets will not be realized. We evaluate the realizability of deferred income tax assets for each of the jurisdictions in which we operate. If we experience cumulative pretax income in a particular jurisdiction in the three-year period including the current and prior two years, we normally conclude that the deferred income tax assets will more likely than not be realizable and no valuation allowance is recognized,
75
unless known or planned operating developments would lead management to conclude otherwise. However, if we experience cumulative pretax losses in a particular jurisdiction in the three-year period including the current and prior two years, we then consider a series of factors in the determination of whether the deferred income tax assets can be realized. These factors include historical operating results, known or planned operating developments, the period of time over which certain temporary differences will reverse, consideration of the utilization of certain deferred income tax liabilities, tax law carryback capability in the particular country, and prudent and feasible tax planning strategies. After evaluation of these factors, if the deferred income tax assets are expected to be realized within the tax carryforward period allowed for that specific country, we would conclude that no valuation allowance would be required. To the extent that the deferred income tax assets exceed the amount that is expected to be realized within the tax carryforward period for a particular jurisdiction, we establish a valuation allowance.
Applying the above methodology, valuation allowances have been established for certain deferred income tax assets to the extent they are not expected to be realized within the particular tax carryforward period.
Deferred taxes associated with U.S. entities from continuing operations consist of net deferred tax liabilities of approximately $336 million and $426 million inclusive of valuation allowances of $21 million and $24 million as of December 31, 2025 and 2024, respectively. Deferred taxes associated with non-U.S. entities from continuing operations consist of net deferred tax liabilities of $1 million and of $15 million, both inclusive of valuation allowances of $247 3.0 million and increased by $15 million during the years ended December 31, 2025 and 2024, respectively, due primarily to foreign credits and net operating losses in both years.
As of December 31, 2025, our U.S. and non-U.S. net operating loss carryforwards totaled $1.6 billion, of which $21 million is related to federal net operating loss carryforwards, $552 million is related to state net operating loss carryforwards, and $1.0 billion is related to non-U.S. net operating loss carryforwards. Included in deferred tax assets as of December 31, 2025 are tax benefits for U.S. and non-U.S. net operating loss carryforwards totaling $191 million, before applicable valuation allowances of $90 million. Certain of these losses can be carried forward indefinitely and others can be carried forward to various dates from 2026 through 2044. Recognition of some of these loss carryforwards is subject to an annual limit, which may cause them to expire before they are used.
As of December 31, 2025, our U.S. and non-U.S. tax credit carryforwards totaled $192 million, which is primarily related to non-U.S. tax credit carryforwards. Certain of these credits can be carried forward indefinitely and other can be carried forward to various dates from 2026 through 2044. As of December 31, 2025, we maintain a $180 million valuation allowance related to certain tax credit carryforwards.
Unrecognized Tax Benefits
We recognize tax benefits from uncertain tax positions only if, in our assessment, it is more likely than not that the tax position will be sustained on examination by the taxing authorities, based on the technical merits of the position. The tax benefits recognized in the financial statements from such positions are measured based on the largest benefit that has a greater than 50% likelihood of being realized upon ultimate settlement. Judgment is required in evaluating tax positions and determining income tax provisions. We re-evaluate the technical merits of our tax positions and may recognize an uncertain tax benefit in certain circumstances, including when: (i) a tax audit is completed; (ii) applicable tax laws change, including a tax case ruling or legislative guidance; or (iii) the applicable statute of limitations expires. We recognize potential accrued interest and penalties associated with unrecognized tax positions in income tax expense.
As of December 31, 2025, gross unrecognized tax benefits for continuing and discontinued operations were $133 million ($147 million total, including $26 million associated with interest and penalties, and net of the impact of $12 million of indirect tax benefits). As of December 31, 2024, gross unrecognized tax benefits for continuing and discontinued operations were $130 million ($144 million total, including $26 million associated with interest and penalties, and net of the impact of $12 million of indirect tax benefits). We recognized approximately $8 million, $10 million and $11 million in potential interest and penalties associated with uncertain tax positions during 2025, 2024, and 2023, respectively. To the extent taxes are not assessed with respect to uncertain tax positions, substantially all amounts accrued (including interest and penalties and net of indirect offsets) will be reduced and reflected as a reduction of the overall income tax provision. Unrecognized tax benefits and associated accrued interest and penalties are included in our income tax provision.
The Company is subject to examination in the United States, various states, and foreign jurisdictions for the tax years 2011 to 2024. These examinations include filings of tax returns prior to our separation from Danaher, tax returns of enterprises no longer in our portfolio, and tax returns for pre-acquisition periods of enterprises added to our portfolio. Significant obligations are detailed in the tax matters agreements in connection with the separation of Fortive from Danaher on July 1, 2016, the split-off of the A&S business on October 1, 2018, the Vontier separation on October 9, 2020, and the PT Separation on June 28, 2025.
76
A reconciliation of the beginning and ending amount of unrecognized tax benefits, excluding amounts accrued for potential interest and penalties, is as follows ($ in millions):
| 2025 | 2024 | 2023 | |||||||||||||||
| Unrecognized tax benefits, beginning of year | $ | $ | $ | ||||||||||||||
| Additions based on tax positions related to the current year | |||||||||||||||||
| Additions for tax positions of prior years | |||||||||||||||||
| Reductions for tax positions of prior years | ( | ( | ( | ||||||||||||||
| Lapse of statute of limitations | ( | ( | ( | ||||||||||||||
| Settlements | ( | ( | ( | ||||||||||||||
| Effect of foreign currency translation | ( | ||||||||||||||||
Acquisition and separation related adjustments | |||||||||||||||||
| Unrecognized tax benefits, end of year | $ | $ | $ | ||||||||||||||
Repatriation and Unremitted Earnings
As of December 31, 2025, we have undistributed earnings of certain foreign subsidiaries that we have indefinitely reinvested, and on which we have not recognized deferred taxes. Estimating the amount of potential tax is not practicable because of the complexity and variety of assumptions necessary to compute the tax.
NOTE 12. LITIGATION AND CONTINGENCIES
We are, from time to time, subject to a variety of litigation and other proceedings incidental to our business, including lawsuits involving claims for damages arising out of the use of our products, software, and services, claims relating to intellectual property matters, employment matters, commercial disputes, and personal injury as well as regulatory investigations or enforcement. We may also become subject to lawsuits as a result of past or future acquisitions or as a result of liabilities retained from, or representations, warranties, or indemnities provided in connection with divested businesses. Some of these lawsuits may include claims for punitive and consequential as well as compensatory damages. Based upon our experience, current information and applicable law, we do not believe that these proceedings and claims will have a material adverse effect on our financial position, results of operations, or cash flows.
While we maintain workers’ compensation, property, cargo, automobile, crime, fiduciary, product, general, and directors’ and officers’ liability insurance (and have acquired rights under similar policies in connection with certain acquisitions) that cover a portion of these claims, this insurance may be insufficient or unavailable to cover such losses. In addition, while we believe we are entitled to indemnification from third parties for some of these claims, these rights may also be insufficient or unavailable to cover such losses. We maintain third party insurance policies up to certain limits to cover certain liability costs in excess of predetermined retained amounts. For most insured risks, we purchase outside insurance coverage only for severe losses (stop loss insurance) and reserves must be established and maintained with respect to amounts within the self-insured retention.
In accordance with accounting guidance, we record a liability in our consolidated financial statements for loss contingencies when a loss is known or considered probable and the amount can be reasonably estimated. If the reasonable estimate of a known or probable loss is a range, and no amount within the range is a better estimate than any other, the minimum amount of the range is accrued. If a loss does not meet the known or probable level but is reasonably possible and a loss or range of loss can be reasonably estimated, the estimated loss or range of loss is disclosed. These reserves consist of specific reserves for individual claims and additional amounts for anticipated developments of these claims as well as for incurred but not yet reported claims. The specific reserves for individual known claims are quantified with the assistance of legal counsel and outside risk insurance professionals where appropriate. In addition, outside risk insurance professionals may assist in the determination of reserves for incurred but not yet reported claims through evaluation of our specific loss history, actual claims reported, and industry trends among statistical and other factors. Reserve estimates are adjusted as additional information regarding a claim becomes known. While we actively pursue financial recoveries from insurance providers, we do not recognize any recoveries until realized or until such time as a sustained pattern of collections is established related to historical matters of a similar nature and magnitude. If risk insurance reserves we have established are inadequate, we would be required to incur an expense equal to the amount of the loss incurred in excess of the reserves, which would adversely affect our net earnings. The amount of our accruals for self-insurance and litigation liability was immaterial as of December 31, 2025 and 2024.
As of December 31, 2025 and 2024, we had approximately $30 million and $33 million, respectively, of guarantees consisting primarily of outstanding standby letters of credit, bank guarantees, and performance and bid bonds. These guarantees have been
77
provided in connection with certain arrangements with vendors, customers, financing counterparties, and governmental entities to secure our obligations and/or performance requirements related to specific transactions. We believe that if the obligations under these instruments were triggered, they would not have a material effect on our consolidated financial statements.
We have entered into agreements to purchase goods or services that are enforceable and legally binding on us and that specify all significant terms, including fixed or minimum quantities to be purchased, fixed, minimum or variable price provisions and the approximate timing of the transaction. Purchase obligations exclude agreements that are cancellable at any time without penalty. As of December 31, 2025, the aggregate amount of our purchase obligations totaled $212 million, of which $203 million are expected to be settled within one year of December 31, 2025.
NOTE 13. STOCK-BASED COMPENSATION
The 2016 Stock Incentive Plan (the “Stock Plan”) provides for the grant of stock appreciation rights, restricted stock units (“RSUs”) and performance stock units (“PSUs”) (collectively, “Stock Awards”), stock options, or any other stock-based award. A total of 46 million shares of our common stock have been authorized for issuance under the Stock Plan. As of December 31, 2025, approximately 12.4 million shares of our common stock remain available for issuance under the Stock Plan.
Stock options under the Stock Plan generally vest pro rata over a four-year period and terminate 10 years from the grant date, though the specific terms of each grant are determined by the Compensation Committee of our Board of Directors. Our executive officers and certain other employees may be awarded stock options with different vesting criteria and stock options granted to non-employee directors are fully vested as of the grant date. Exercise prices for stock options granted under the Stock Plan were equal to the closing price of Fortive’s common stock on the NYSE on the date of grant, while stock options issued as conversion awards in connection with the separation from Danaher were priced to maintain the economic value before and after the separation.
RSUs granted under the Stock Plan provide for the issuance of common stock at no cost to the holder. RSUs granted to employees generally vest over four years , although certain other employees and non-employee directors may be awarded RSUs with different time-based vesting criteria. Certain members of our senior management are also awarded incremental RSUs subject to performance-based vesting criteria. Prior to vesting, RSUs do not have dividend equivalent rights, do not have voting rights, and the shares underlying the RSUs are not considered issued or outstanding.
PSUs granted under the Stock Plan provide for the issuance of a share of the Company’s common stock at no cost to the holder and will vest at 0 % to 200 % of the target share amount based on achievement of performance targets. Grants made prior to 2022 are earned based on the Company’s total shareholder return ranking relative to the S&P 500 Index over a performance period of approximately three years . For grants made subsequent to 2022, the performance target is based on a mix of both achievement of an internal growth metric and the Company’s total shareholder return ranking, both over a performance period of approximately three years . PSUs issued are subject to an additional holding period of up to one year and are entitled to dividend equivalent rights. The PSU dividend equivalent rights are subject to the same vesting and payment restrictions as the related shares, but do not have voting rights and the shares underlying the PSUs are not considered issued and outstanding.
Other than pursuant to any retirement benefits provided under our Stock Plan, the equity compensation awards granted by the Company generally vest only if the employee is employed by us (or in the case of directors, the director continues to serve on the Board) on the vesting date. To cover the exercise of stock options and vesting of RSUs and PSUs, we generally issue shares authorized but previously unissued, although we may instead issue treasury shares; provided, however, that either type of issuance would equally reduce the number of shares available under our Stock Plan.
We account for stock-based compensation by measuring the cost of employee services received in exchange for all equity awards granted based on the fair value of the award as of the grant date. We recognize the compensation expense over the requisite service period (which is generally the vesting period but may be shorter than the vesting period, for example, if the employee becomes retirement eligible before the end of the vesting period).
The fair value of RSUs and performance based PSUs is calculated using the closing price of Fortive common stock on the date of grant. RSU’s are further adjusted for the impact of RSUs not having dividend rights prior to vesting. The fair value of market-based PSUs is calculated using a Monte Carlo pricing model. The fair value of the stock options granted is calculated using a Black-Scholes Merton (“Black-Scholes”) option pricing model.
Stock-based Compensation Expense
Stock-based compensation has been recognized as a component of Selling, general, and administrative expenses in the Consolidated Statements of Earnings. The amount of stock-based compensation expense recognized during a period is based on the portion of the awards that are ultimately expected to vest. We estimate pre-vesting forfeitures at the time of grant by
78
analyzing historical data and revise those estimates in subsequent periods if actual forfeitures differ from those estimates. Ultimately, the total expense recognized over the vesting period will equal the fair value of awards that actually vest.
The following summarizes the components of our stock-based compensation expense under the Stock Plan for the years ended December 31 ($ in millions):
| 2025 | 2024 | 2023 | |||||||||||||||
| Stock Awards: | |||||||||||||||||
| Pretax compensation expense | $ | $ | $ | ||||||||||||||
| Income tax benefit | ( | ( | ( | ||||||||||||||
| Stock Award expense, net of income taxes | |||||||||||||||||
| Stock options: | |||||||||||||||||
| Pretax compensation expense | |||||||||||||||||
| Income tax benefit | ( | ( | ( | ||||||||||||||
| Stock option expense, net of income taxes | |||||||||||||||||
| Total stock-based compensation: | |||||||||||||||||
| Pretax compensation expense | |||||||||||||||||
| Income tax benefit | ( | ( | ( | ||||||||||||||
Total stock-based compensation, net of income taxes | $ | $ | $ | ||||||||||||||
When stock options are exercised by the employee or Stock Awards vest, we derive a tax deduction measured by the excess of the market value on such date over the grant date price. Accordingly, we record the excess of the tax benefit related to the exercise of stock options and vesting of Stock Awards over the expense recorded for financial statement reporting purposes (the “Excess Tax Benefit”) as a component of Income tax expense and as an operating cash inflow in the consolidated financial statements. During the years ended December 31, 2025, 2024, and 2023 we realized an Excess Tax Benefit of $5.2 million, $7.1 million, and $3.2 million, respectively, related to stock options that were exercised and Stock Awards that vested.
The following summarizes the unrecognized compensation cost for the Stock Plan awards as of December 31, 2025. This compensation cost is expected to be recognized over a weighted average period of approximately 2 years, representing the remaining service period related to the awards. Future compensation amounts will be adjusted for any changes in estimated forfeitures ($ in millions):
| Stock Awards | $ | ||||
| Stock options | |||||
| Total unrecognized compensation cost | $ | ||||
Ralliant Separation
In connection with the Separation and in accordance with the employee matters agreement between Fortive and Ralliant, the number of shares underlying each stock-based award outstanding as of the date of the Separation was multiplied by a factor of 1.3662 and the related exercise price for the stock options was divided by a factor of 1.3662 , which was intended to preserve the intrinsic value of the awards immediately prior to the Separation. The adjustment factor was calculated using the Fortive common stock per share price at the close of market on June 27, 2025 relative to the 3 -trading day volume weighted average price of Fortive common stock immediately after the Separation. Stock-based awards of Fortive held by employees who transferred to Ralliant in the Separation were converted into stock-based awards of Ralliant issued under Ralliant’s stock plan. Additionally, at the completion of the Separation, we accelerated the recognition of compensation expense related to certain Stock Awards due to executive retirements. In the year ended December 31, 2025, we recorded $33 million of stock based compensation expense related to these adjustments within Selling, general, and administrative expenses in the Consolidated Statement of Earnings.
79
Stock Options
The following summarizes the assumptions used in the Black-Scholes model to value stock options granted under the Stock Plan during the years ended December 31:
| 2025 | 2024 | 2023 | |||||||||||||||
Weighted-average grant-date fair value | $ | $ | $ | ||||||||||||||
Assumptions: | |||||||||||||||||
| Risk-free interest rate | |||||||||||||||||
Volatility (a) | % | % | % | ||||||||||||||
Dividend yield (b) | % | % | % | ||||||||||||||
| Expected years until exercise | |||||||||||||||||
(a) Expected volatility for 2025 was based on is based on the company’s historical stock price volatility from July 2, 2016 (the date of separation from Danaher) through the stock option grant date. Expected volatility for 2024 and 2023 were weighted average blend of the company’s historical stock price volatility from July 2, 2016 (the date of separation from Danaher) through the stock option grant date and the average historical stock price volatility of a group of peer companies for the expected term of the options. | |||||||||||||||||
(b) The dividend yield is calculated by dividing our annual dividend, based on the most recent quarterly dividend rate, by Fortive’s closing stock price on the grant date. | |||||||||||||||||
The following summarizes option activity under the Stock Plan (in millions, except price per share and numbers of years):
Options (a) | Weighted Average Exercise Price | Weighted Average Remaining Contractual Term (years) | Aggregate Intrinsic Value | ||||||||||||||||||||
Outstanding as of December 31, 2023 | $ | ||||||||||||||||||||||
| Granted | |||||||||||||||||||||||
| Exercised | ( | ||||||||||||||||||||||
| Canceled/forfeited | ( | ||||||||||||||||||||||
Outstanding as of December 31, 2024 | |||||||||||||||||||||||
| Granted | |||||||||||||||||||||||
| Exercised | ( | ||||||||||||||||||||||
| Canceled/forfeited | ( | ||||||||||||||||||||||
Adjustment due to PT Separation (b) | ( | ||||||||||||||||||||||
| Outstanding as of December 31, 2025 | $ | ||||||||||||||||||||||
Vested and expected to vest as of December 31, 2025 (c) | $ | ||||||||||||||||||||||
| Exercisable as of December 31, 2025 | $ | ||||||||||||||||||||||
(a) The outstanding options as of December 31, 2024 and the option activity prior to December 31, 2024 (except those options canceled as part of the PT Separation as noted below) have been adjusted by a factor of | |||||||||||||||||||||||
(b) The “Adjustment due to PT Separation” reflects the cancellation of outstanding options held by Ralliant employees as of June 27, 2025, which were replaced with Ralliant options issued by Ralliant as part of the PT Separation. | |||||||||||||||||||||||
(c) The “expected to vest” options are the net unvested options that remain after applying the forfeiture rate assumption to total unvested options. | |||||||||||||||||||||||
The aggregate intrinsic values in the table above represent the total pretax intrinsic value (the difference between the closing stock price of Fortive common stock on the last trading day of 2025 and the exercise price, multiplied by the number of in-the-money options) that would have been received by the option holders had all option holders exercised their options on December 31, 2025. The amount of aggregate intrinsic value will change based on the price of Fortive’s common stock.
The following summarizes aggregate intrinsic value and cash receipts related to stock options that were exercised under the Stock Plan for the years ended December 31 ($ in millions):
| 2025 | 2024 | 2023 | |||||||||||||||
| Aggregate intrinsic value of stock options exercised | $ | $ | $ | ||||||||||||||
| Cash receipts from stock options exercised | $ | $ | $ | ||||||||||||||
80
Stock Awards
The following summarizes information related to Stock Award activity under the Stock Plan for the years ended December 31, 2025 and 2024 (in millions; except price per share):
Number of Stock Awards (a) | Weighted Average Grant-Date Fair Value | ||||||||||
| Unvested as of December 31, 2023 | $ | ||||||||||
| Granted | |||||||||||
Vested (b) | ( | ||||||||||
| Forfeited | ( | ||||||||||
| Unvested as of December 31, 2024 | |||||||||||
| Granted | |||||||||||
Vested (b) | ( | ||||||||||
| Forfeited | ( | ||||||||||
Adjustment due to PT Separation (c) | ( | ||||||||||
| Unvested as of December 31, 2025 | |||||||||||
(a) The outstanding stock awards as of December 31, 2024 and the option activity prior to December 31, 2024 (except those options canceled as part of the PT Separation as noted below) have been adjusted by a factor of | |||||||||||
(b) The fair value of Stock Awards vested during the year ended December 31, 2025, 2024, and 2023 was $ | |||||||||||
(c) The “Adjustment due to PT Separation” reflects the cancellation of unvested awards held by Ralliant employees as of June 27, 2025, which were replaced with Ralliant equity awards issued by Ralliant as part of the PT Separation. | |||||||||||
NOTE 14. CAPITAL STOCK AND EARNINGS PER SHARE
Common Stock
Under our amended and restated certificate of incorporation, as of July 1, 2016, our authorized capital stock consists of 2.0 billion common shares with a par value of $0.01 per share and 15 million preferred shares with a par value of $0.01 per share.
Each share of our common stock entitles the holder to one vote on all matters to be voted upon by common stockholders. Our Board is authorized to issue shares of preferred stock in one or more series and has discretion to determine the rights, preferences, privileges, and restrictions, including voting rights, dividend rights, conversion rights, redemption privileges, and liquidation preferences, of each series of preferred stock. The Board’s authority to issue preferred stock with voting rights or conversion rights that, if exercised, could adversely affect the voting power of the holders of common stock, could potentially discourage attempts by third parties to obtain control of the Company through certain types of takeover practices. We currently pay a quarterly dividend of $0.06 per share on our common stock.
81
Share Repurchase Program
On February 17, 2022, our Board approved a share repurchase program authorizing us to repurchase up to 20 million shares of our outstanding common stock (the “General Share Repurchase Program”). Under this program, shares may be repurchased from time to time on the open market or in privately negotiated transactions, including under accelerated share repurchase programs or under plans complying with Rule 10b5-1 under the Securities Exchange Act of 1934, as amended (“10b5-1 Plans”). On May 27, 2025, in connection with the Separation, our Board adopted a separate and incremental special purpose share repurchase program (the “Special Purpose Share Repurchase Program”) under which we may purchase up to $550 million in our common stock exclusively from the proceeds we received as a dividend from Ralliant in connection with the Separation (the “Ralliant Dividend”), together with any other cash received from Ralliant in connection with the Separation (collectively, the “Ralliant Cash Proceeds”). Repurchases of shares of our common stock using the Ralliant Cash Proceeds will only be made through the Special Purpose Share Repurchase Program.
On May 27, 2025 and November 5, 2025, our Board increased the number of shares authorized under the General Share Repurchase Program by an additional 15.6 million and 12.1 million shares, respectively. As of December 31, 2025, there were 15.5 million shares remaining authorized under the General Share Repurchase Program and $67.5 million remaining authorized under the Special Share Repurchase Program, respectively. There is no expiration date for the repurchase programs, and the timing and amount of repurchases under the programs are determined by our management based on market conditions, tax regulations and other factors. The repurchase programs may be suspended or discontinued at any time by the Board. Refer to Part II - Item 5 for additional information.
During the years ended December 31, 2025, 2024, and 2023, respectively, we purchased 30 million, 12 million, and 4 million shares of our common stock at an average share price of $52.79 and $73.93 , and $68.20 . Our common stock repurchases in excess of issuances are subject to a 1% excise tax enacted by the Inflation Reduction Act. Any excise tax incurred is recorded as part of the cost basis of the shares acquired within Common stock repurchases in the Consolidated Statement of Equity. The payment of the excise tax is recorded within Repurchase of common shares in the Consolidated Statement of Cash Flows.
Net Earnings Per Share
Basic net earnings per share (“EPS”) is calculated by dividing net earnings by the weighted average number of shares of common stock outstanding for the applicable period. Diluted EPS from continuing operations is similarly calculated, except that the calculation includes the dilutive effect of the assumed issuance of shares under stock-based compensation plans under the treasury stock method, except where the inclusion of such shares would have an anti-dilutive impact.
For the years ended December 31, 2025, 2024, and 2023, the anti-dilutive options to purchase shares excluded from the diluted EPS calculation were 1.0 million shares, 1.2 million shares, and 0.5 million shares, respectively.
Information related to the calculation of net earnings per share of common stock is summarized as follows ($ and shares in millions, except per share amounts):
| Year Ended December 31, | |||||||||||||||||
| 2025 | 2024 | 2023 | |||||||||||||||
| Numerator | |||||||||||||||||
Net earnings from continuing operations | $ | $ | $ | ||||||||||||||
| Denominator | |||||||||||||||||
| Weighted average common shares outstanding used in basic earnings per share | |||||||||||||||||
| Incremental common shares from: | |||||||||||||||||
| Assumed exercise of dilutive options and vesting of dilutive Stock Awards | |||||||||||||||||
| Weighted average common shares outstanding used in diluted earnings per share | |||||||||||||||||
Net earnings from continuing operations per common share - Basic | $ | $ | $ | ||||||||||||||
Net earnings from continuing operations per common share - Diluted | $ | $ | $ | ||||||||||||||
NOTE 15. SEGMENT INFORMATION
We report our results in two separate business segments consisting of Intelligent Operating Solutions and Advanced Healthcare Solutions. We determine our business segments based on the identification of segment managers and similarities in products,
82
end markets, economic characteristics, technologies, and services, as well as the financial data utilized by the Company's chief executive officer. The Company's chief operating decision maker ("CODM") is the chief executive officer.
The CODM uses gross profit and operating profit at the segment level to assess performance and allocate resources, including merger and acquisition targets. The CODM also compares the actual results to expectations in assessing the performance of the segments. Operating expenses generally include selling, general and administrative expenses, and research and development expenses. Depreciation expense is allocated between Cost of sales and Selling, general, and administrative expenses. Amortization expense is recorded within Selling, general, and administrative expenses. The identifiable assets by segment are those used in each segment’s operations. Inter-segment amounts are not significant and are eliminated in the combined totals. Unallocated costs and other costs are not considered part of our evaluation of reportable segment operating performance.
Segment results for the year ended December 31, 2025 are shown below ($ in millions):
Total | Intelligent Operating Solutions | Advanced Healthcare Solutions | Unallocated Corporate Costs and Other (a) | ||||||||||||||||||||
Sales | $ | $ | $ | $ | |||||||||||||||||||
Cost of sales | ( | ( | ( | ||||||||||||||||||||
Gross profit | |||||||||||||||||||||||
Operating expenses | ( | ( | ( | ( | |||||||||||||||||||
Operating profit (loss) | ( | ||||||||||||||||||||||
Non-operating income (expense), net | |||||||||||||||||||||||
Interest expense, net | ( | ( | |||||||||||||||||||||
Other non-operating expense, net | |||||||||||||||||||||||
| Earnings from continuing operations before income taxes | $ | $ | $ | $ | ( | ||||||||||||||||||
Depreciation and amortization expenses | $ | ( | $ | ( | $ | ( | $ | ( | |||||||||||||||
Capital expenditure | $ | ( | $ | ( | $ | ( | $ | ( | |||||||||||||||
(a) Unallocated Corporate Costs and Other included $ | |||||||||||||||||||||||
Segment results for the year ended December 31, 2024 are shown below ($ in millions):
Total | Intelligent Operating Solutions | Advanced Healthcare Solutions | Unallocated Corporate Costs and Other | ||||||||||||||||||||
Sales | $ | $ | $ | $ | |||||||||||||||||||
Cost of sales | ( | ( | ( | ||||||||||||||||||||
Gross profit | |||||||||||||||||||||||
Operating expenses | ( | ( | ( | ( | |||||||||||||||||||
Operating profit (loss) | ( | ||||||||||||||||||||||
Non-operating income (expense), net | |||||||||||||||||||||||
Interest expense, net | ( | ( | |||||||||||||||||||||
Other non-operating expense, net (a) (b) | ( | ( | |||||||||||||||||||||
| Earnings from continuing operations before income taxes | $ | $ | $ | $ | ( | ||||||||||||||||||
Depreciation and amortization expenses | $ | ( | $ | ( | $ | ( | $ | ( | |||||||||||||||
Capital expenditure | $ | ( | $ | ( | $ | ( | $ | ( | |||||||||||||||
(a) During 2024, we pledged a charitable contribution of $ | |||||||||||||||||||||||
(b) We recorded a loss from equity investments of $ | |||||||||||||||||||||||
83
Segment results for the year ended December 31, 2023 are shown below ($ in millions):
Total | Intelligent Operating Solutions | Advanced Healthcare Solutions | Unallocated Corporate Costs and Other | ||||||||||||||||||||
Sales | $ | $ | $ | $ | |||||||||||||||||||
Cost of sales | ( | ( | ( | ||||||||||||||||||||
Gross profit | |||||||||||||||||||||||
Operating expenses | ( | ( | ( | ( | |||||||||||||||||||
Operating profit (loss) | ( | ||||||||||||||||||||||
Non-operating income (expense), net | |||||||||||||||||||||||
Interest expense, net | ( | ( | |||||||||||||||||||||
Other non-operating expense, net (a) | ( | ( | |||||||||||||||||||||
| Earnings from continuing operations before income taxes | $ | $ | $ | $ | ( | ||||||||||||||||||
Depreciation and amortization expenses | $ | ( | $ | ( | $ | ( | $ | ( | |||||||||||||||
Capital expenditure | $ | ( | $ | ( | $ | ( | $ | ( | |||||||||||||||
(a) We recorded a loss from equity investments of $ | |||||||||||||||||||||||
Segment Assets:
As of December 31, | |||||||||||
| ($ in millions) | 2025 | 2024 | |||||||||
| Intelligent Operating Solutions | $ | $ | |||||||||
| Advanced Healthcare Solutions | |||||||||||
| Total segment assets | |||||||||||
Other (a) | |||||||||||
Assets of discontinued operations | |||||||||||
| Total assets | $ | $ | |||||||||
(a) Other represents corporate assets which consist primarily of cash, property, plant, and equipment, and net deferred income tax assets. | |||||||||||
Operations in Geographic Areas:
As of December 31, | |||||||||||
| ($ in millions) | 2025 | 2024 | |||||||||
| Property, plant and equipment, net: | |||||||||||
| United States | $ | $ | |||||||||
All other | |||||||||||
| Total | $ | $ | |||||||||
84
NOTE 16. QUARTERLY DATA - UNAUDITED
| ($ in millions, except per share data) | 1st Quarter | 2nd Quarter | 3rd Quarter | 4th Quarter | |||||||||||||||||||
| 2025: | |||||||||||||||||||||||
Sales | $ | $ | $ | $ | |||||||||||||||||||
| Gross profit | |||||||||||||||||||||||
| Operating profit | |||||||||||||||||||||||
| Net earnings from continuing operations | |||||||||||||||||||||||
Net earnings (loss) from discontinued operations | ( | ( | |||||||||||||||||||||
| Net earnings | |||||||||||||||||||||||
Net earnings (loss) per common share - basic: | |||||||||||||||||||||||
Continuing operations | |||||||||||||||||||||||
| Discontinued operations | ( | ( | |||||||||||||||||||||
Net earnings per common share - basic | |||||||||||||||||||||||
Net earnings (loss) per common share - diluted: | |||||||||||||||||||||||
Continuing operations | |||||||||||||||||||||||
| Discontinued operations | ( | ( | |||||||||||||||||||||
Net earnings per common share - diluted | |||||||||||||||||||||||
| 2024: | |||||||||||||||||||||||
Sales | $ | $ | $ | $ | |||||||||||||||||||
| Gross profit | |||||||||||||||||||||||
| Operating profit | |||||||||||||||||||||||
| Net earnings from continuing operations | |||||||||||||||||||||||
Net earnings from discontinued operations | |||||||||||||||||||||||
| Net earnings | |||||||||||||||||||||||
| Earnings per common share - basic: | |||||||||||||||||||||||
Continuing operations | |||||||||||||||||||||||
| Discontinued operations | |||||||||||||||||||||||
Net earnings per common share - basic | |||||||||||||||||||||||
| Earnings per common share - diluted: | |||||||||||||||||||||||
Continuing operations | |||||||||||||||||||||||
| Discontinued operations | |||||||||||||||||||||||
Net earnings per common share - diluted | |||||||||||||||||||||||
| The sum of net earnings per share amount may not add due to rounding. | |||||||||||||||||||||||
85
ITEM 9. CHANGES IN AND DISAGREEMENTS WITH ACCOUNTANTS ON ACCOUNTING AND FINANCIAL DISCLOSURE
Not applicable.
ITEM 9A. CONTROLS AND PROCEDURES
Our management, with the participation of the President and Chief Executive Officer, and Senior Vice President and Chief Financial Officer, has evaluated the effectiveness of our disclosure controls and procedures (as such term is defined in Rules 13a-15(e) and 15d-15(e) under the Securities Exchange Act of 1934, as amended (the “Exchange Act”)) as of the end of the period covered by this report. Based on such evaluation, the President and Chief Executive Officer, and Senior Vice President and Chief Financial Officer, have concluded that, as of the end of such period, these disclosure controls and procedures were effective.
Management’s annual report on its internal control over financial reporting (as such term is defined in Rules 13a-15(f) under the Exchange Act) and the independent registered public accounting firm’s audit report on the effectiveness of the Company’s internal control over financial reporting are included in Item 8. Financial Statements and Supplementary Data, under the headings “Report of Management on Fortive Corporation’s Internal Control Over Financial Reporting” and “Report of Independent Registered Public Accounting Firm,” respectively, and are incorporated herein by reference.
There have been no changes in our internal control over financial reporting that occurred during the most recent completed fiscal quarter that have materially affected, or are reasonably likely to materially affect, our internal control over financial reporting.
ITEM 9B. OTHER INFORMATION
(a) Departure of a Director
On February 24, 2026, Eric Branderiz notified the Board of Directors (the “Board”) of the Company that he has elected not to stand for re-election as a director at the Company’s 2026 Annual Meeting of Shareholders (the “Annual Meeting”) to be held on June 9, 2026, and will retire from the Board effective on the date of the Annual Meeting. Mr. Branderiz’s decision was not the result of any disagreement with the Company on any matter relating to the Company’s operations, policies or practices. In connection with such notice of retirement, on February 25, 2026, the Board approved the reduction of the size of the Board from nine to eight directors, subject to, and concurrently with, the effectiveness of the retirement of Mr. Branderiz from the Board on the date of the Annual Meeting.
(b) Disclosures Pursuant to Section 10(b) of the Securities Exchange Act of 1934
During the fourth quarter ended December 31, 2025, no directors or Section 16 officers adopted terminated
ITEM 9C. DISCLOSURE REGARDING FOREIGN JURISDICTIONS THAT PREVENT INSPECTIONS
Not applicable.
PART III
ITEM 10. DIRECTORS, EXECUTIVE OFFICERS AND CORPORATE GOVERNANCE
Other than the information below, the information required by this Item is incorporated by reference from the sections entitled Directors and Corporate Governance in the Proxy Statement for our 2026 annual meeting and to the information under the caption “Information about our Executive Officers” in Part I hereof. No nominee for director was selected pursuant to any arrangement or understanding between the nominee and any person other than the Company pursuant to which such person is or was to be selected as a director or nominee.
Code of Ethics
We have adopted a code of business conduct and ethics for directors, officers (including Fortive’s principal executive officer, principal financial officer and principal accounting officer) and employees, known as the Fortive Code. The Fortive Code is available in the “Our Culture-Integrity & Compliance” section of our website at www.fortive.com.
86
We intend to disclose any amendment to the Fortive Code that relates to any element of the code of ethics definition enumerated in Item 406(b) of Regulation S-K, and any waiver from a provision of the Fortive Code granted to any director, principal executive officer, principal financial officer, principal accounting officer, or any of our other executive officers, in the “Our Culture-Integrity & Compliance” section of our website, at www.fortive.com, within four business days following the date of such amendment or waiver.
Insider Trading Arrangements and Policies
The Company has an insider trading policy governing the purchase, sale and other dispositions of the Company’s securities that applies to all Company personnel, including directors, officers, employees, and other covered persons, and the Company itself. The Company believes that its insider trading policy is reasonably designed to promote compliance with insider trading laws, rules and regulations, and any applicable listing standards. A copy of the Company’s insider trading policy is incorporated by reference as Exhibit 19.1 to this Annual Report on Form 10-K.
ITEM 11. EXECUTIVE COMPENSATION
The information required by this Item is incorporated by reference from the sections entitled Compensation Discussion and Analysis, Compensation Committee Report, Executive Compensation Tables, Pay Ratio Disclosure, Compensation Committee Interlocks and Insider Participation and Director Compensation in the Proxy Statement for our 2026 annual meeting.
ITEM 12. SECURITY OWNERSHIP OF CERTAIN BENEFICIAL OWNERS AND MANAGEMENT AND RELATED STOCKHOLDER MATTERS
The information required by this Item is incorporated by reference from the sections entitled Ownership of Our Stock, and Equity Compensation Plan Information in the Proxy Statement for our 2026 annual meeting.
ITEM 13. CERTAIN RELATIONSHIPS AND RELATED TRANSACTIONS, AND DIRECTOR INDEPENDENCE
The information required by this Item is incorporated by reference from the sections entitled Corporate Governance - Director Independence and Certain Relationships and Related Transactions in the Proxy Statement for our 2026 annual meeting.
ITEM 14. PRINCIPAL ACCOUNTANT FEES AND SERVICES
The information required by this Item is incorporated by reference from the section entitled Ratification of Independent Registered Public Accounting Firm in the Proxy Statement for our 2026 annual meeting.
87
PART IV
ITEM 15. EXHIBITS AND FINANCIAL STATEMENT SCHEDULES
a) The following documents are filed as part of this report.
(1)Financial Statements. The financial statements, including the report of independent registered public accounting firm (PCAOB ID: 42 ), are set forth under “Item 8. Financial Statements and Supplementary Data” of this Annual Report on Form 10-K.
(2)Schedules. An index of Exhibits and Schedules is on page 92 of this report. Schedules other than those listed below have been omitted from this Annual Report on Form 10-K because they are not required, are not applicable or the required information is included in the financial statements or the notes thereto.
(3)Exhibits. The exhibits listed in the accompanying Exhibit Index are filed or incorporated by reference as part of this Annual Report on Form 10-K.
ITEM 16. FORM 10-K SUMMARY
Not applicable.
FORTIVE CORPORATION
INDEX TO FINANCIAL STATEMENTS, SUPPLEMENTARY DATA AND FINANCIAL STATEMENT SCHEDULE
| Page Number in Form 10-K | |||||
| Schedule: | |||||
| Valuation and Qualifying Accounts | |||||
EXHIBIT INDEX
| Exhibit Number | Description | |||||||||||||
| 2.1 | Incorporated by reference from Exhibit 2.1 to Fortive Corporation’s Current Report on Form 8-K filed on June 30, 2025 (Commission File Number: 1-37654) | |||||||||||||
| 3.1 | Incorporated by reference from Exhibit 3.1 to Fortive Corporation’s Quarterly Report on Form10-Q for the quarter ended June 28, 2024 (Commission File Number: 1-37654) | |||||||||||||
| 3.2 | Incorporated by reference from Exhibit 3.1 to Fortive Corporation’s Current Report on Form 8-K filed on November 8, 2022 (Commission File Number: 1-37654) | |||||||||||||
| 4.1 | Incorporated by reference from Exhibit 4.2 to Fortive Corporation’s Annual Report on Form 10-K for the year ended December 31, 2022 (Commission File Number: 1-37654) | |||||||||||||
88
| 4.2 | Incorporated by reference from Exhibit 4.1 to Fortive Corporation’s Current Report on Form 8-K filed on June 21, 2016 (Commission File Number: 1-37654) | |||||||||||||
| 4.3 | Incorporated by reference from Exhibit 4.1 to Fortive Corporation’s Current Report on Form 8-K filed on February 13, 2024 (Commission File Number: 1-37654) | |||||||||||||
| 4.4 | Incorporated by reference from Exhibit 4.2 to Fortive Corporation’s Current Report on Form 8-K filed on February 13, 2024 (Commission File Number: 1-37654) | |||||||||||||
| 10.1 | Incorporated by reference from Exhibit 10.1 to Fortive Corporation’s Current Report on Form 8-K filed on October 20, 2022 (Commission File Number: 1-37654) | |||||||||||||
| 10.2 | Incorporated by reference to Exhibit 10.1 to Fortive Corporation’s Current Report on Form 8-K filed on December 12, 2023 (Commission File Number: 1-37654) | |||||||||||||
| 10.3 | Incorporated by reference from Exhibit 10.1 to Fortive Corporation’s Current Report on Form 8-K, filed on June 30, 2025 (Commission File No. 1-37654) | |||||||||||||
| 10.4 | Incorporated by reference from Exhibit 10.2 to Fortive Corporation’s Current Report on Form 8-K, filed on June 30, 2025 (Commission File No. 1-37654) | |||||||||||||
| 10.5 | Incorporated by reference from Exhibit 10.3 to Fortive Corporation’s Current Report on Form 8-K, filed on June 30, 2025 (Commission File No. 1-37654) | |||||||||||||
| 10.6 | Incorporated by reference from Exhibit 10.4 to Fortive Corporation’s Current Report on Form 8-K, filed on June 30, 2025 (Commission File No. 1-37654) | |||||||||||||
| 10.7 | Incorporated by reference from Exhibit 10.5 to Fortive Corporation’s Current Report on Form 8-K, filed on June 30, 2025 (Commission File No. 1-37654) | |||||||||||||
| 10.8 | Incorporated by reference from Exhibit 10.6 to Fortive Corporation’s Current Report on Form 8-K, filed on June 30, 2025 (Commission File No. 1-37654) | |||||||||||||
| 10.9 | Incorporated by reference from Exhibit 4.3 to Fortive Corporation’s Registration Statement on Form S-8, filed on October 17, 2025 (Commission File No. 333-290931 | |||||||||||||
89
| 10.10 | Incorporated by reference from Exhibit 10.1 to Fortive Corporation’s Quarterly Report on Form 10-Q for the year ended April 1, 2022 (Commission File Number: 1-37654) | |||||||||||||
| 10.11 | Incorporated by reference from Exhibit 10.1 to Fortive Corporation’s Quarterly Report on Form 10-Q for the quarter ended June 28, 2024 (Commission File Number: 1-37654) | |||||||||||||
| 10.12 | Incorporated by reference from Exhibit 10.2 to Fortive Corporation’s Quarterly Report on Form 10-Q for the quarter ended June 28, 2024 (Commission File Number: 1-37654) | |||||||||||||
| 10.13 | Incorporated by reference from Exhibit 10.11 to Fortive Corporation’s Annual Report on Form 10-K for the year ended December 31, 2017 (Commission File Number: 1-37654) | |||||||||||||
| 10.14 | Incorporated by reference from Exhibit 10.12 to Fortive Corporation’s Annual Report on Form 10-K for the year ended December 31, 2017 (Commission File Number: 1-37654) | |||||||||||||
| 10.15 | Incorporated by reference from Exhibit 10.13 to Fortive Corporation’s Annual Report on Form 10-K for the year ended December 31, 2017 (Commission File Number: 1-37654) | |||||||||||||
| 10.16 | Incorporated by reference from Exhibit 10.18 to Fortive Corporation’s Annual Report on Form 10-K for the year ended December 31, 2018 (Commission File Number: 1-37654) | |||||||||||||
| 10.17 | Incorporated by reference from Exhibit 10.1 to Fortive Corporation’s Current Report on Form 8-K, filed on March 31, 2017 (Commission File Number: 1-37654) | |||||||||||||
| 10.18 | Incorporated by reference from Exhibit 10.10 to Fortive Corporation’s Current Report on Form 8-K filed on June 1, 2016 (Commission File Number: 1-37654) | |||||||||||||
| 10.19 | Incorporated by reference from Exhibit 10.10 to Amendment No. 2 to Fortive Corporation’s Registration Statement on Form 10, filed on April 7, 2016 (Commission File Number: 1-37654) | |||||||||||||
| 10.20 | Incorporated by reference from Exhibit 10.16 to Fortive Corporation’s Annual Report on Form 10-K for the year ended December 31, 2023 (Commission File Number: 1-37654) | |||||||||||||
| 10.21 | Incorporated by reference from Exhibit 10.1 to Fortive Corporation’s Quarterly Report on Form 10-Q for the quarter ended September 27, 2024 (Commission File Number: 1-37654) | |||||||||||||
90
| 10.22 | Incorporated by reference from Exhibit 10.2 to Fortive Corporation’s Quarterly Report on Form 10-Q for the quarter ended September 27, 2024 (Commission File Number: 1-37654) | |||||||||||||
| 10.23 | Incorporated by reference from Exhibit 10.22 to Fortive Corporation’s Annual Report on Form 10-K for the year ended December 31, 2024 (Commission File Number: 1-37654) | |||||||||||||
| 10.24 | Incorporated by reference from Exhibit 10.3 to Fortive Corporation’s Quarterly Report on Form 10-Q for the quarter ended March 28, 2025 (Commission File Number: 1-37654) | |||||||||||||
| 10.25 | Incorporated by reference from Exhibit 10.6 to Amendment No. 1 to Fortive Corporation’s Registration Statement on Form 10, filed on March 3, 2016 (Commission File Number: 1-37654) | |||||||||||||
| 10.26 | Incorporated by reference from Exhibit 10.21 to Fortive Corporation’s Annual Report on Form 10-K for the year ended December 31, 2024. (Commission File No. 1-37654) | |||||||||||||
| 10.27 | ||||||||||||||
| 10.28 | Incorporated by reference from Exhibit 10.34 to Fortive Corporation’s Annual Report on Form 10-K for the year ended December 31, 2020 (Commission File Number: 1-37654) | |||||||||||||
| 10.29 | Incorporated by reference from Exhibit 10.23 to Fortive Corporation’s Annual Report on Form 10-K for the year ended December 31, 2016 (Commission File Number: 1-37654) | |||||||||||||
| 10.30 | ||||||||||||||
| 10.31 | ||||||||||||||
| 10.32 | Incorporated by reference from Exhibit 10.1 to Fortive Corporation’s current report on Form 8-K, filed on March 2, 2023 (Commission File No. 1-37654) | |||||||||||||
| 10.33 | Incorporated by reference from Exhibit 10.25 to Fortive Corporation’s Annual Report on Form 10-K for the year ended December 31, 2024 (Commission File No. 1-37654) | |||||||||||||
91
| 10.34 | Incorporated by reference from Exhibit 10.5 to Fortive Corporation’s Quarterly Report on Form 10-Q for the quarter ended March 28, 2025 (Commission File Number: 1-37654) | |||||||||||||
| 19.1 | Incorporated by reference from Exhibit 19.1 to Fortive Corporation’s Annual Report on Form 10-K for the year ended December 31, 2024 (Commission File No. 1-37654) | |||||||||||||
| 21.1 | ||||||||||||||
| 23.1 | ||||||||||||||
| 31.1 | ||||||||||||||
| 31.2 | ||||||||||||||
| 32.1 | ||||||||||||||
| 32.2 | ||||||||||||||
| 97 | Incorporated by reference from Exhibit 97 to Fortive Corporation’s Annual Report on Form 10-K for the year ended December 31, 2023 (Commission File Number: 1-37654) | |||||||||||||
| 101.INS | XBRL Instance Document - the instance document does not appear in the Interactive Data File because its XBRL tags are embedded within the Inline XBRL document † | |||||||||||||
| 101.SCH | Inline XBRL Taxonomy Extension Schema Document † | |||||||||||||
| 101.CAL | Inline XBRL Taxonomy Extension Calculation Linkbase Document † | |||||||||||||
| 101.DEF | Inline XBRL Taxonomy Extension Definition Linkbase Document † | |||||||||||||
| 101.LAB | Inline XBRL Taxonomy Extension Label Linkbase Document † | |||||||||||||
| 101.PRE | Inline XBRL Taxonomy Extension Presentation Linkbase Document † | |||||||||||||
92
| 104 | Inline Cover page formatted as Inline XBRL and contained in Exhibit 101 | |||||||||||||
| * | Indicates management contract or compensatory plan, contract or arrangement. | ||||
† | Filed electronically herewith. | ||||
The registrant agrees to furnish to the Commission supplementally upon request a copy of (i) any instrument with respect to long-term debt not filed herewith as to which the total amount of securities authorized thereunder does not exceed 10% of the total assets of the registrant and its subsidiaries on a consolidated basis and (ii) schedules or similar attachments omitted pursuant to Item 601(a)(5) of Regulation S-K.
93
SIGNATURES
Pursuant to the requirements of Section 13 or 15(d) of the Securities Exchange Act of 1934, the Registrant has duly caused this report to be signed on its behalf by the undersigned, thereunto duly authorized.
| FORTIVE CORPORATION | ||||||||
| Date: February 25, 2026 | By: | /s/ OLUMIDE O. SOROYE | ||||||
Olumide O. Soroye | ||||||||
| President and Chief Executive Officer | ||||||||
94
Pursuant to the requirements of the Securities Exchange Act of 1934, this annual report has been signed below by the following persons on behalf of the Registrant and in the capacities and on the date indicated:
| Name, Title and Signature | Date | ||||||||||
| /s/ SHARMISTHA DUBEY | February 25, 2026 | ||||||||||
| Sharmistha Dubey | |||||||||||
| Chairman of the Board | |||||||||||
| /s/ ERIC BRANDERIZ | February 25, 2026 | ||||||||||
| Eric Branderiz | |||||||||||
| Director | |||||||||||
| /s/ DANIEL L. COMAS | February 25, 2026 | ||||||||||
| Daniel L. Comas | |||||||||||
| Director | |||||||||||
| /s/ REJJI P. HAYES | February 25, 2026 | ||||||||||
| Rejji P. Hayes | |||||||||||
| Director | |||||||||||
| /s/ WRIGHT LASSITER III | February 25, 2026 | ||||||||||
| Wright Lassiter III | |||||||||||
| Director | |||||||||||
| /s/ KATE D. MITCHELL | February 25, 2026 | ||||||||||
| Kate D. Mitchell | |||||||||||
| Director | |||||||||||
/s/ GREGORY MOORE | February 25, 2026 | ||||||||||
Gregory Moore | |||||||||||
| Director | |||||||||||
| /s/ JEANNINE P. SARGENT | February 25, 2026 | ||||||||||
| Jeannine P. Sargent | |||||||||||
| Director | |||||||||||
/s/ OLUMIDE O. SOROYE | February 25, 2026 | ||||||||||
Olumide O. Soroye | |||||||||||
| President, Chief Executive Officer and Director | |||||||||||
/s/ MARK D. OKERSTROM | February 25, 2026 | ||||||||||
Mark D. Okerstrom | |||||||||||
| Senior Vice President and Chief Financial Officer | |||||||||||
| /s/ CHRISTOPHER M. MULHALL | February 25, 2026 | ||||||||||
| Christopher M. Mulhall | |||||||||||
| Chief Accounting Officer | |||||||||||
95
FORTIVE CORPORATION AND SUBSIDIARIES
SCHEDULE II—VALUATION AND QUALIFYING ACCOUNTS
($ in millions)
| Classification | Balance at Beginning of Period | Charged to Costs & Expenses | Impact of Currency | Charged to Other Accounts | Write Offs, Write Downs & Deductions | Balance at End of Period | |||||||||||||||||||||||||||||
| Year Ended December 31, 2025: | |||||||||||||||||||||||||||||||||||
| Allowances deducted from asset accounts | |||||||||||||||||||||||||||||||||||
| Allowance for credit losses | $ | $ | $ | $ | ( | $ | ( | $ | |||||||||||||||||||||||||||
| Year Ended December 31, 2024: | |||||||||||||||||||||||||||||||||||
| Allowances deducted from asset accounts | |||||||||||||||||||||||||||||||||||
| Allowance for credit losses | $ | $ | $ | ( | $ | $ | ( | $ | |||||||||||||||||||||||||||
| Year Ended December 31, 2023: | |||||||||||||||||||||||||||||||||||
| Allowances deducted from asset accounts | |||||||||||||||||||||||||||||||||||
| Allowance for credit losses | $ | $ | $ | $ | $ | ( | $ | ||||||||||||||||||||||||||||
96